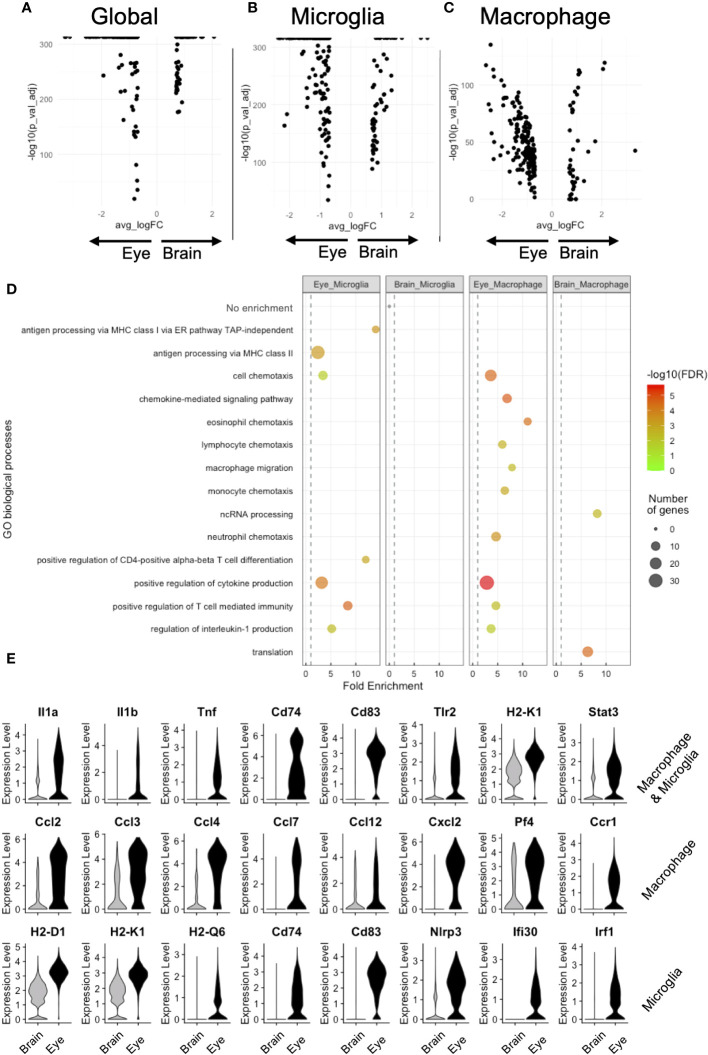
Figure 4.
DE analysis demonstrates greater antigen presentation via MHC class I and inflammation in eye microglia compared to brain microglia. Volcano plots for global (A), microglia (B), and macrophage (C) DE genes. (D) GO enrichment of DE genes for eye and brain microglia subsets. (E) Violin plot visualization of DE genes associated with GO processes. FDR, false-discovery rate.

