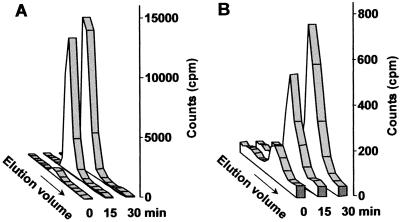
Figure 2.
Concomitant increase in osmotic stress-induced PtdIns(4,5)P2 and IP3 levels. Sorbitol (at a final concentration of 1 m) was added to myo-[2-3H]inositol-labeled plants and an equivalent number of plants were withdrawn at 0, 15, and 30 min. A, The elution profile of gPI(4,5)P2 (elution volume of 41–46 mL) is shown. B, The elution profile of inositol 1,4,5-trisphosphate (elution volume of 55–60 mL) is shown. For each HPLC run, the aqueous or organic sample each contained 1 × 10⁶ cpm.

