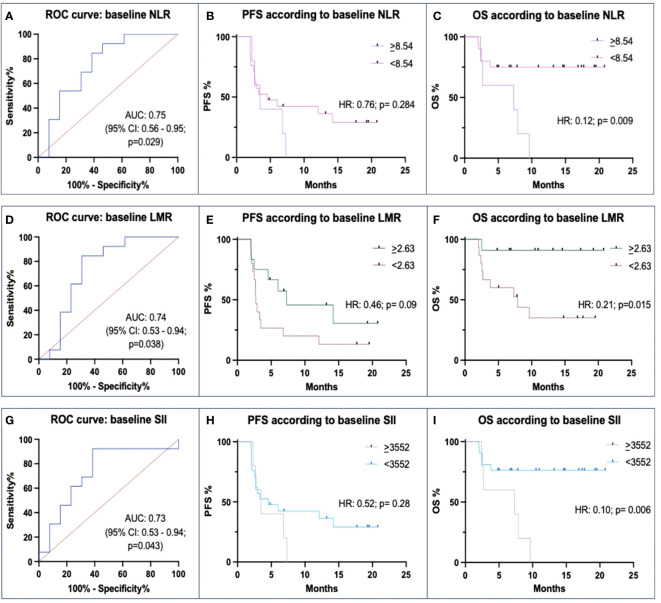
Figure 2.
Correlations between baseline Neutrophil-to-lymphocyte ratio (NLR), Lymphocyte-to-monocyte ratio (LMR), Systemic inflammation index (SII) and ICIs efficacy. (A, D, G) ROC curves of baseline levels between responders (Rs) and not-responders (N-Rs) show differences for NLR, LMR, and SII. (B, E, H) Kaplan-Meier analyses for PFS show a not significant impact of threshold values. (C, F, I) Kaplan-Meier analyses for OS show a significant impact of different baseline levels of NLR, LMR, and SII.

