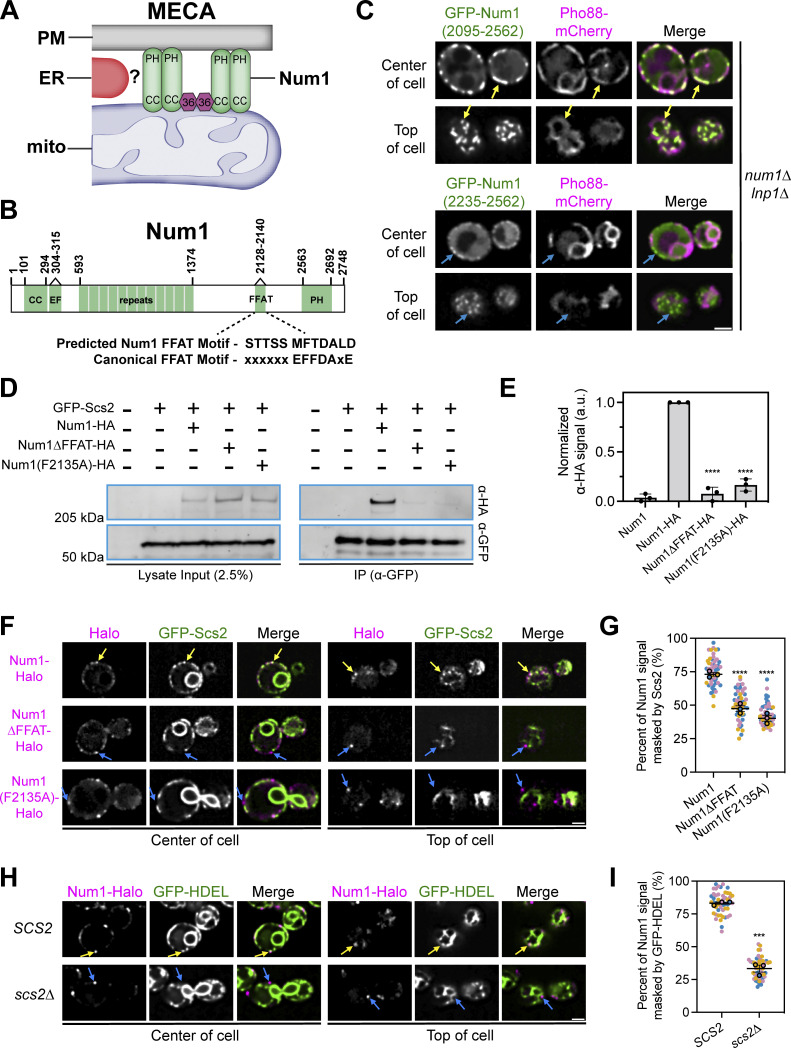
Figure 1.
Num1 interacts with the integral ER protein Scs2 via a C-terminal FFAT motif. (A) Cartoon representation of the mitochondria–ER–cortex anchor (MECA). Num1 (green) interacts directly with mitochondrial membranes and the PM via its coiled-coil (CC) and pleckstrin homology (PH) domains, respectively. Mdm36 (purple hexagon) enhances Num1 self-association. Num1 interacts with the ER (red) via an unknown mechanism. (B) Cartoon domain schematic of Num1 comparing the predicted FFAT motif to the canonical FFAT motif. EF, EF hand-like motif. FFAT, two phenylalanines in an acidic tract. (C) Truncation analysis to identify the minimal region required to localize Num1 to the ER. The indicated Num1 truncations were expressed from the strong GPD promoter in a num1∆ lnp1∆ background. The ER was marked with Pho88-mCherry. Yellow arrows point to cortical, punctate accumulations of Num1(2095-2562) that colocalize with the ER. Blue arrows point to cortical, punctate accumulations of Num1(2235–2562) that do not colocalize with the ER. Images are single slices from the center and top of the same cell. Scale bar, 2 µm. (D) Coimmunoprecipitation of Num1, but not Num1∆FFAT or Num1(F2135A), with Scs2. Cells expressing GFP-Scs2 with the indicated Num1 alleles were lysed and subjected to affinity purification with an α-GFP antibody followed by SDS-PAGE and Western blot analysis. A representative blot of three independent experiments is shown. (E) Quantification of the coimmunoprecipitation experiments in D. For each lane, the α-HA signal at the expected Num1 MW (313 kD) was quantified and normalized to the intensity of the band from the Num1-HA lysate. Each dot represents one experimental replicate and the error bars represent SEM. To determine statistical significance, an ordinary one-way ANOVA with multiple comparisons was used (**** = P < 0.0001). All statistical analyses are in comparison to the Num1-HA condition. (F) Fluorescence micrographs of cells expressing genomically tagged Num1-Halo, Num1(F2135A)-Halo or Num1∆FFAT-Halo, and GFP-Scs2. Images are single slices from the center or top of the same cell. Individual channels are shown in grayscale. Yellow arrows indicate Num1 foci that contain Scs2 while blue arrows indicate foci that do not contain Scs2. Scale bar, 2 µm. (G) Quantification of the amount of Num1 signal that is masked by Scs2. See Materials and methods for a detailed description of the quantification methodology. Each dot represents one cell. Imaging replicates are depicted as different colors and the average of each replicate is shown as a circle of the appropriate color with a black outline. At least 50 cells per condition were measured. The horizontal line indicates the mean of the three imaging replicates with error bars representing SEM. To determine statistical significance, an ordinary one-way ANOVA with multiple comparisons was used. All statistics are in comparison to Num1 (**** = P < 0.0001). (H and I) The same as F and G except the cells expressed Num1-Halo and the ER marker GFP-HDEL in a wild type or scs2∆ background. Scale bar, 2 µm. To determine statistical significance, an unpaired t test was used (*** = P < 0.001). Source data are available for this figure: SourceData F1.

