Figure 2.
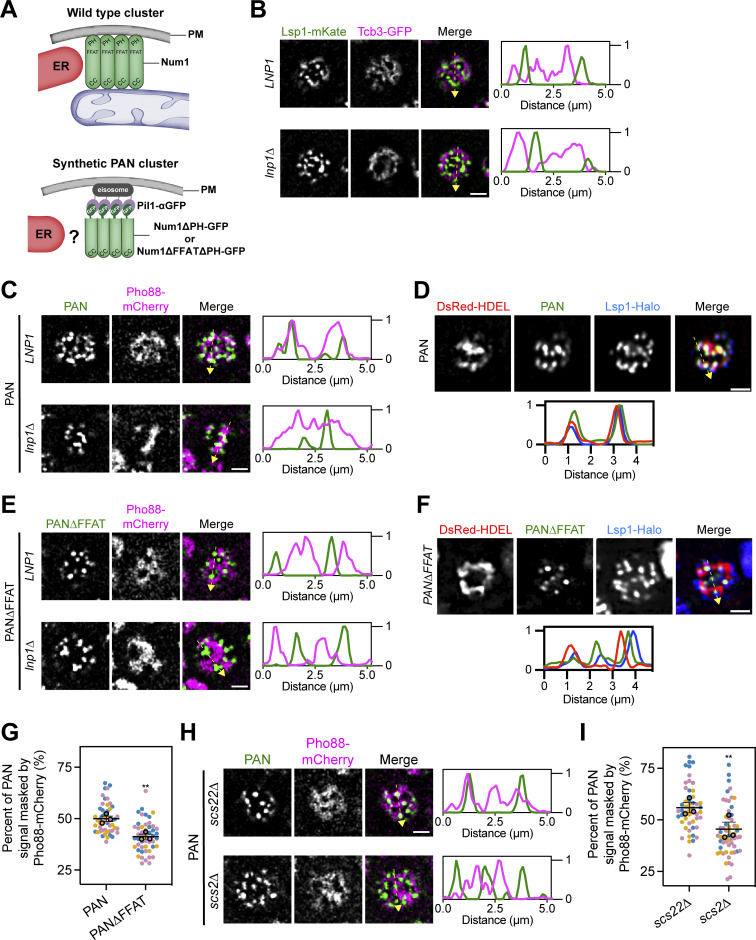
The Num1–Scs2 interaction is sufficient to tether ER and eisosomes. (A) Cartoon representation of wild type Num1 clusters and Num1 clusters generated using the PAN system. Wild type Num1 clusters require mitochondria for formation and are ER-associated (Kraft and Lackner, 2017). PAN clusters are formed by targeting GFP-tagged Num1 alleles lacking the PH domain to Pil1 fused to an α-GFP nanobody (Schmit et al., 2018). Whether PAN clusters are associated with ER is unknown. PAN; Pil1-associated-Num1. (B) Fluorescence micrographs of cells expressing an eisosome marker, Lsp1-mKate, and a cortical ER marker, Tcb3-GFP, in both an LNP1 and lnp1∆ background. Individual channels are shown in grayscale. Images are a single slice from the top of a cell. The dashed yellow arrow marks the location analyzed in the accompanying linescans to the right of the micrographs. Scale bar, 2 µm. (C) Fluorescence micrographs of PAN cells expressing the ER marker Pho88-mCherry. Images and linescans are arrayed in the same manner as B. (D) Images of PAN cells expressing the ER marker DsRed-HDEL and an eisosome marker Lsp1-Halo. Images are arrayed in the same manner as B except the linescan is depicted below. (E and F) Identical to C and D except cells expressed Num1∆FFAT∆PH-GFP. (G) Quantification of the percentage of Num1∆PH-GFP or Num1∆FFAT∆PH-GFP signal masked by Pho88-mCherry from the data sets from C and E. The quantification was performed and presented in (Fig. 1 G). To determine statistical significance, an unpaired t test was used (** = P < 0.01). (H) Fluorescence micrographs of PAN cells expressing the ER marker Pho88-mCherry in a scs22∆ or scs2∆ background. Images and linescans are arrayed in the same manner as B. (I) Quantification of the data in H, performed and presented the same as in Fig. 1 G.

