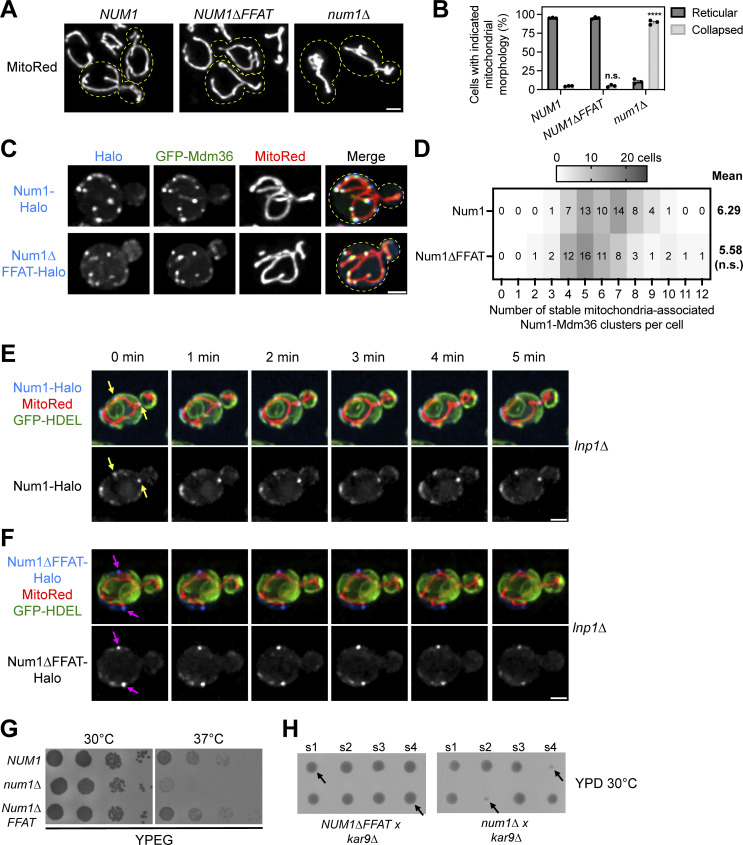
Figure 3.
The Num1–Scs2 interaction is not required for Num1 to function as a mitochondrial tether or dynein anchor. (A) Representative micrographs of cells expressing the mitochondrial matrix marker MitoRed in the indicated genetic backgrounds. Yellow dashed lines indicate cell outlines. Scale bar, 2 µm. (B) Quantification of the percentage of cells from A that display either reticular or collapsed mitochondrial networks. Each dot represents one imaging replicate containing 100 cells. The error bars represent the SEM between the three replicates. A detailed description of the quantification methodology is presented in the methods section. To determine the statistical significance between the percentage of collapsed mitochondrial networks seen per condition, an ordinary one-way ANOVA with multiple comparisons was used (n.s. = not significant, **** = P < 0.0001). All statistical analyses are in comparison to NUM1 cells. (C) Fluorescence micrographs of cells expressing genomically tagged Num1-Halo or Num1∆FFAT-Halo with GFP-Mdm36 and the mitochondrial matrix marker MitoRed. Images are max projections of a full Z-stack. Individual channels are shown in grayscale. Yellow dashed lines indicate the cell outlines. Scale bar, 2 µm. (D) Quantification of the number of stable mitochondria-associated Num1-Mdm36 clusters per cell from the data shown in C. See Materials and methods for a detailed description of the quantification methodology. The mean number of tethering points is indicated to the right of the heat map. 58 cells were counted per condition. Statistical significance was determined by an unpaired t test (n.s. = not significant). (E) Images from Video 1 of cells expressing genomically tagged Num1-Halo, MitoRed, and GFP-HDEL in an lnp1∆ background. Images are max projections of a full Z-stack. The Num1-Halo channel is shown in grayscale. The yellow arrows indicate ER-associated, Num1-mediated mitochondrial tethering points that persist throughout the time course. Scale bar, 2 μm. (F) Images from Video 2 which is identical to E except the cells expressed Num1∆FFAT-Halo. The magenta arrows indicate Num1∆FFAT-mediated mitochondrial tethering points that are not ER-associated and persist throughout the time course. (G) 10-fold serial dilutions of the indicated strains were spotted on YPEG medium and grown at 30°C or 37°C for 2 days. The image is a representative example of three biological replicates. (H) Diploid NUM1∆FFAT kar9∆ and num1∆ kar9∆ cells were sporulated, and the spores from individual tetrads were arranged in a column on YPD medium. The s1-4 label denotes spores 1-4 from an individual tetrad. Two tetrads are shown per background and black arrows point to double mutants. The images are representative of at least 12 tetrad dissections.

