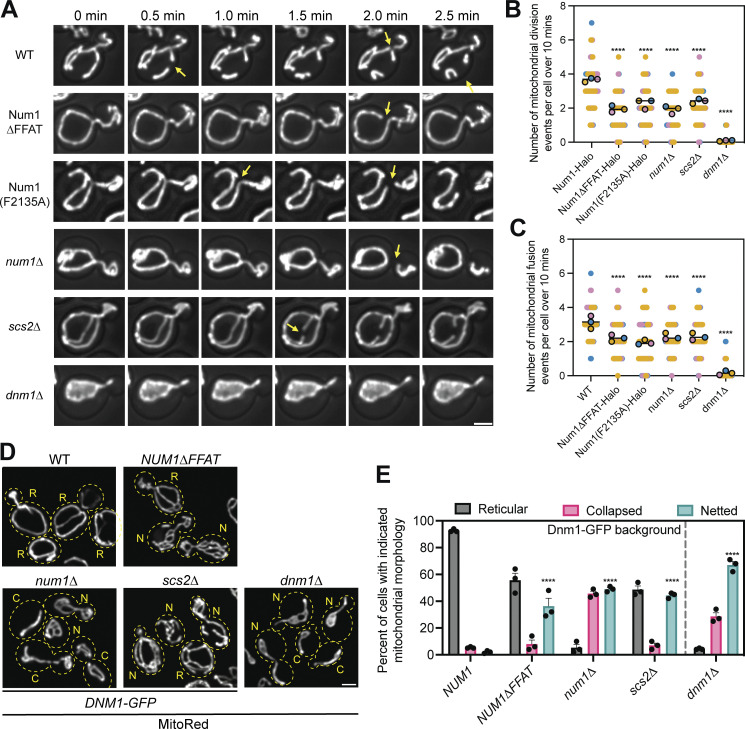
Figure 4.
Loss of the Num1–Scs2 interaction reduces the rate of mitochondrial division. (A) Selected micrographs from Video 3 of cells expressing the mitochondrial matrix marker MitoRed in the indicated genetic backgrounds. Z-stacks were collected every 30 s for 10 min. Images are max projections of the full Z-stack. Yellow arrows indicate mitochondrial division events. The fluorescence signal is shown in grayscale merged with a BF image. Scale bar, 2 µm. Images are taken from various points throughout the supplemental video to highlight mitochondrial division events. The time above the images references the time elapsed between images, not the specific time from Video 3. (B) Quantification of the number of mitochondrial division events observed per cell over 10 min. Mitochondrial division events were manually scored by examining full Z-stacks to determine when two mitochondrial tubules separated. Imaging replicates are depicted as different colors and the average of each replicate is shown as a circle of the appropriate color with a black outline. Each replicate contains twenty cells for a total of 60 cells measured per condition. The horizontal line indicates the mean of the three imaging replicates with error bars representing SEM. To determine statistical significance, an ordinary one-way ANOVA with multiple comparisons was used (**** = P < 0.0001). All statistical analyses are in comparison to Num1-Halo. (C) The same as B except mitochondrial fusion events were scored. (D) Representative micrographs of cells expressing the mitochondrial matrix marker MitoRed and a C-terminally tagged version of Dnm1-GFP from the endogenous DNM1 locus in the indicated genetic background. Dashed yellow lines indicate cell outlines. The accompanying letter indicates the category of mitochondrial morphology that particular cell was scored as: R = reticular, N = netted, C = collapsed. See Materials and methods section for a detailed explanation of how each category was determined. Scale bar, 2 μm. (E) Quantification of the percentage of cells displaying the indicated mitochondrial morphology for each genetic background. Each dot represents one imaging replicate containing 100 cells. The bars represent the average of the three imaging replicates and the error bars represent SEM. To determine statistical significance, an ordinary one-way ANOVA with multiple comparisons was used (**** = P < 0.0001). All statistical analyses are in comparison to NUM1 and are comparing the netted category.

