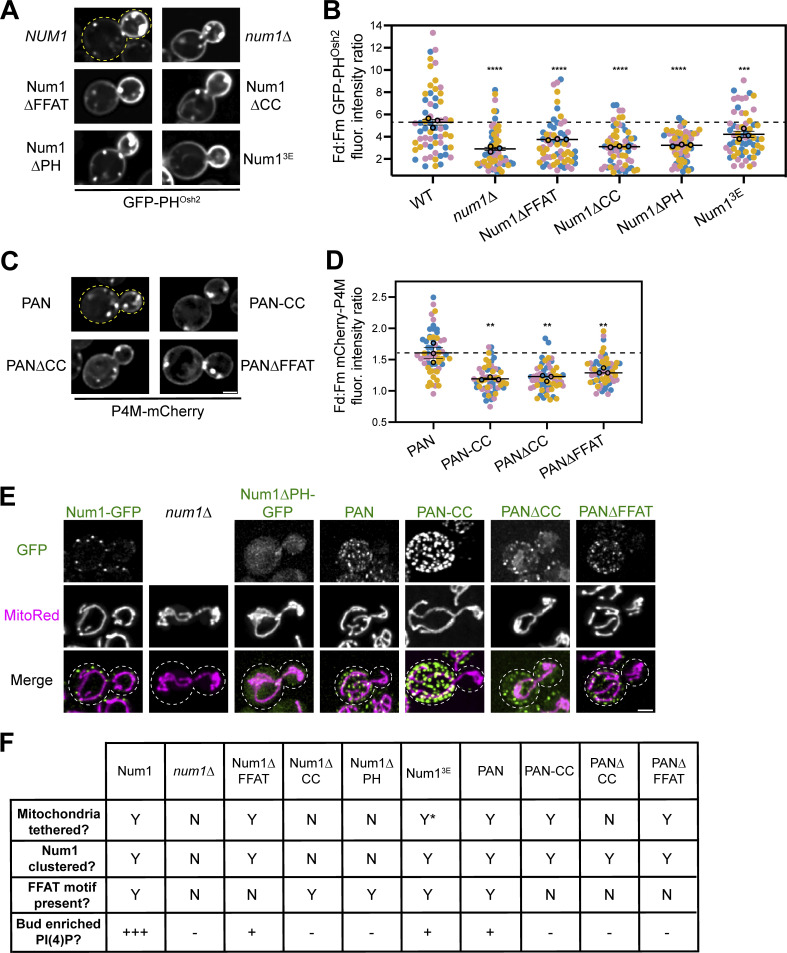
Figure 6.
The function of Num1 as a mitochondria–ER–PM tether is required to maintain polarized PI(4)P distribution. (A) Representative fluorescence micrographs of cells expressing the indicated Num1 alleles and GFP-PHOsh2. Yellow dashed lines represent cell outlines. Scale bar, 2 µm. (B) Quantification of the ratio of GFP-PHOsh2 enrichment in daughter cells compared to mother cells in the indicated genetic backgrounds using the strategy depicted in Fig. 5 I. Quantification was performed and is presented identically to Fig. 5 J. The dashed black line depicts the average GFP-PHOsh2 enrichment in WT cells. To determine statistical significance, an ordinary one-way ANOVA with multiple comparisons was used (*** = P < 0.001, **** = P < 0.0001). All statistical analyses are in comparison to the WT condition. The WT and num1∆ data are duplicated from Fig. 5 J to aid visual comparison. (C) Representative fluorescence micrographs of cells expressing the indicated PAN variants and P4M-mCherry. Scale bar, 2 µm. (D) Quantification of the ratio of mCherry-P4M enrichment in daughter cells compared to mother cells expressing the indicated PAN alleles using the strategy depicted in Fig. 5 I. Quantification was performed and is presented identically to Fig. 5 J. The dashed black line depicts the average mCherry-P4M enrichment in PAN cells. To determine statistical significance, an ordinary one-way ANOVA with multiple comparisons was used (** = P < 0.01). All statistical analyses are in comparison to the PAN condition. (E) Array of representative fluorescence micrographs showing the indicated Num1 or PAN alleles with the mitochondrial matrix marker MitoRed. Individual channels are shown in grayscale. Images are max projections of a full Z-stack. Scale bar, 2 µm. Dashed white lines represent cell outlines. Due to variations in construct expression, the green channels are set to different brightness/contrast settings to enhance visualization, and the intensity between images should not be directly compared. (F) Table summarizing whether mitochondria are tethered to the PM, whether Num1 is clustered on the PM, whether the Num1 FFAT motif is present, and the degree of enrichment of PI(4)P on the daughter cell PM compared to the mother in the indicated strains. Y = yes, N = no. “Y*” means that the indicated trait is present but significantly reduced compared to wild type. For the bud enriched PI(4)P category, “+++” = an average daughter:mother fluorescence ratio of GFP-PHOsh2 ≥ 5, “+” = between 5 and 3.25, and “–” = <3.25. For categories measured using P4M, “+” = an average daughter:mother fluorescence ratio of P4M > 1.5, and “–” = between 1 and 1.5.

