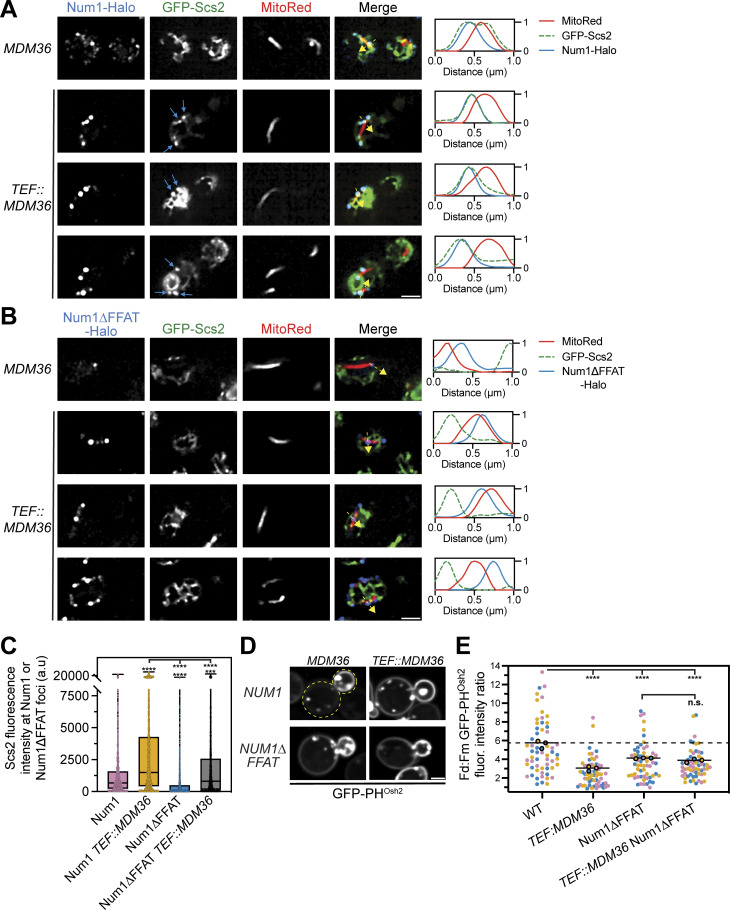
Figure 7.
Overexpression of Mdm36 enhances recruitment of Scs2 to Num1 foci and alters PI(4)P distribution. (A) Fluorescence micrographs of cells expressing genomically tagged Num1-Halo with GFP-Scs2 and MitoRed in a wild type or Mdm36 overexpression background. Mdm36 overexpression was achieved by replacing the endogenous promoter with the strong TEF promoter. Individual channels are shown in grayscale. Images are single slices from the top of cells. Three representative examples of the Mdm36 overexpression strain are shown. The blue arrows indicate punctate accumulations of Scs2 that colocalize with Num1. The dashed yellow arrows mark the location analyzed in the accompanying linescans to the right of the micrographs. Scale bar, 2 µm. (B) Identical to A except cells expressed Num1∆FFAT-Halo. (C) Quantification of A and B. Briefly, the Num1-Halo or Num1∆FFAT-Halo signal from a single slice from a Z-stack at the top of a cell was used to generate a mask and measure the GFP-Scs2 signal at individual Num1 foci. Each dot in the box and whisker plot represents the GFP-Scs2 fluorescence measured at an individual Num1 foci and the black line indicates the mean. See Materials and methods for a detailed description of the quantification methodology. To determine statistical significance, an ordinary one-way ANOVA with multiple comparisons was used (**** = P < 0.0001, *** = P < 0.001). Statistical analyses without brackets are in comparison to Num1 with endogenous Mdm36 expression levels and those indicated with brackets are in comparison to Num1 with overexpressed Mdm36. (D) Fluorescence micrographs of cells in the indicated genetic backgrounds expressing GFP-PHOsh2. Yellow dashed lines indicate cell outlines. Scale bar, 2 µm. (E) Quantification of D performed and presented identically to Fig. 5 J. The WT and Num1∆FFAT data are replicated from Fig. 5 J and Fig. 6 B to aid visual comparison.

