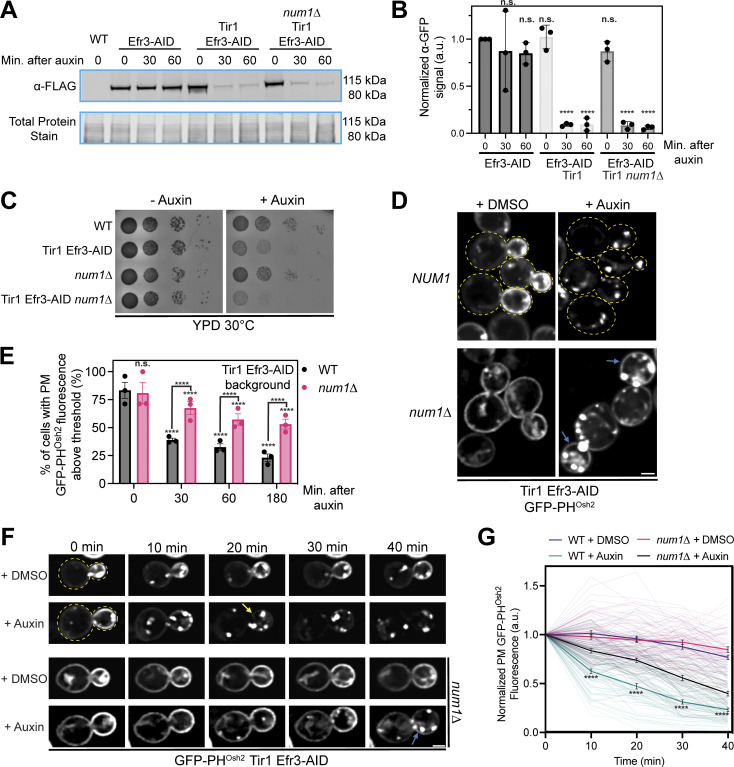
Figure 8.
Loss of PM PI(4)P upon inactivation of PIK patches is slowed in num1∆ cells. (A) Efficient degradation of Efr3-AID via the auxin-inducible degradation system. Western blot analysis of Efr3-AID protein levels upon addition of auxin for the indicated time lengths. (B) Quantification of the Western blot in A and two other replicates. For each replicate, the intensity of the Efr3-AID band was quantified and normalized to the signal from the respective total protein stain. Data points were then normalized to the Efr3-AID signal at time 0 of cells that did not express Tir1. To determine statistical significance, an ordinary one-way ANOVA with multiple comparisons was used (n.s. = not significant, **** = P < 0.0001). All statistical analyses are in comparison to the Efr3-AID signal at time 0 of cells that did not express Tir1 condition. (C) 10-fold serial dilutions of the indicated strains were spotted on YPD + DMSO or YPD + 1 mM auxin medium and grown at 30°C for 2 days. The image is a representative example of three biological replicates. (D) Fluorescence micrographs of cells expressing Tir1, Efr3-AID, and GFP-PHOsh2 in a wild type or num1∆ background after DMSO or auxin treatment for 3 h. Yellow dashed lines indicate cell outlines. Blue arrows indicate PM-localized GFP-PHOsh2 signal that is visible after auxin treatment. Scale bar, 2 µm. (E) Quantification of the data from D. Cells were grown to mid log phase, treated with auxin, and imaged at the indicated timepoints. Each dot represents the average percent of cells that contained PM-localized GFP-PHOsh2 fluorescence above a threshold value from one imaging replicate. The threshold value was calculated by averaging multiple measurements of the PM of cells that contained no GFP-PHOsh2 prior to auxin treatment. Imaging replicates contained between 34 and 74 cells per replicate for a total of 128–214 cells per timepoint. To determine statistical significance, an ordinary one-way ANOVA with multiple comparisons was used (n.s. = not significant, **** = P < 0.0001). Asterisks immediately above the bars are in comparison to the 0 timepoint of the respective genetic background. (F) Loss of PM PI(4)P upon inactivation of PIK patches is slower in num1∆ cells. Cells were grown to mid-log phase, adhered to a ConA treated confocal dish, and imaged before and at 10-min intervals after the introduction of DMSO or 1 mM auxin. Images are fluorescent micrographs displaying the progressive loss of GFP-PHOsh2 from the PM only in auxin treated cells. Yellow dashed lines indicate the cell outlines. The yellow arrow indicates the frame in which GFP-PHOsh2 signal is no longer detected at the PM. The blue arrow indicates clear GFP-PHOsh2 signal on the PM after 40 min of auxin treatment. Scale bar, 2 μm. (G) Quantification of the data in F. Each transparent line represents the normalized PM fluorescence intensity of a single cell through the course of the movie. PM fluorescence measurements were taken from the region that had the highest signal at each timepoint. Dark lines represent the averages for each condition and error bars represent SEM. Each condition contains data from 42 to 67 cells over three movies. To determine statistical significance, an ordinary one-way ANOVA with multiple comparisons was used (n.s. = not significant, **** = P < 0.0001). The statistical comparisons are between WT + auxin and num1∆ + auxin at each indicated time point. Source data are available for this figure: SourceData F8.

