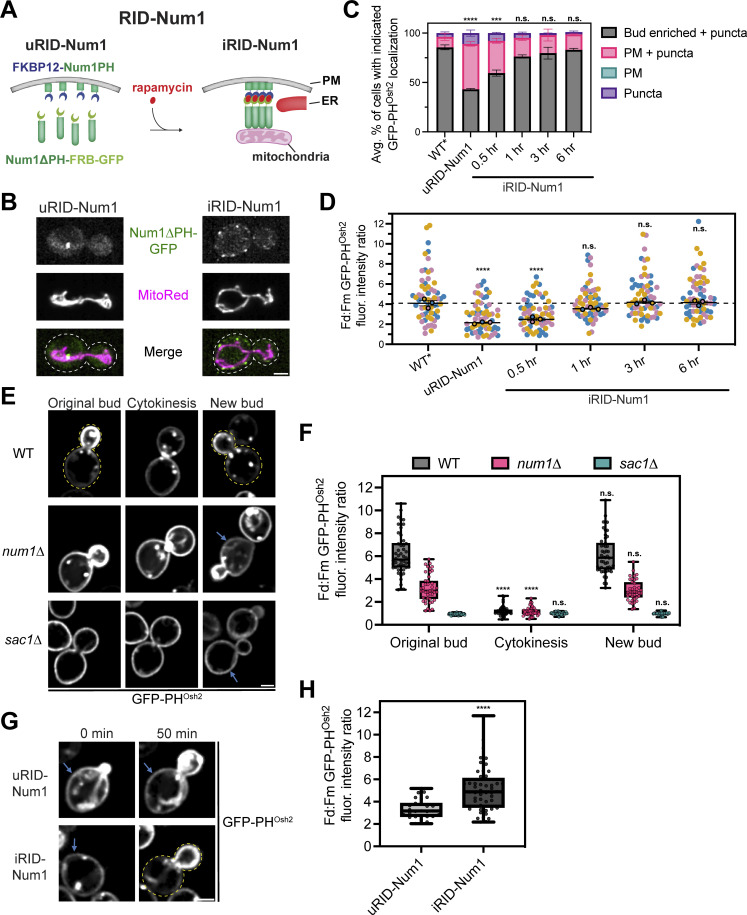
Figure 9.
Inducing mitochondria–ER–PM tethering restores polarized PI(4)P distribution. (A) A cartoon representation of the rapamycin-inducible Num1 clustering system (RID-Num1). The Num1PH domain is tagged with FKBP12 and expressed from the TEF promoter while Num1∆PH-FRB-GFP is expressed from the endogenous NUM1 locus. The addition of rapamycin causes the components to dimerize and self-associate to form mitochondria–ER–PM tethering points. uRID-Num1 = uninduced RID-Num1, iRID-Num1 = induced RID-Num1. (B) Micrographs depicting Num1-RID cells before (uRID) and after (iRID) addition of rapamycin. Individual channels are shown in grayscale. Dashed white lines indicate cell outlines. Scale bar, 2 µm. (C and D) For these experiments, a variant of the RID system was used that expressed Num1∆PH-FRB rather than Num1∆PH-FRB-GFP. In addition, WT refers to the rapamycin resistant background harboring the tor1-1 fpr1∆ mutations and is denoted as WT*. In panel C, quantification of the percentage of cells in the indicated genetic backgrounds showing the GFP-PHOsh2 localization patterns depicted in Fig. 5 G before and after addition of rapamycin to RID-Num1 cells is shown. Quantification was performed and is presented identically to Fig. 5 H. In panel D, quantification of the GFP-PHOsh2 enrichment of daughter cells compared to mother cells before and after the introduction of rapamycin to Num1-RID cells is shown. Quantification was performed and is presented identically to Fig. 5 J. The dashed black line depicts the average GFP-PHOsh2 enrichment in WT* cells. To determine statistical significance, an ordinary one-way ANOVA with multiple comparisons was used (n.s. = not significant, *** = P < 0.001, **** = P < 0.0001). All statistical analyses are in comparison to the WT* condition and, for C, is comparing the Bud enriched + puncta category. (E) PI(4)P distribution changes throughout the cell cycle. Images are representative frames at the indicated cell cycle stages (original bud, cytokinesis, new bud) from Video 4. Cells expressing GFP-PHOsh2 in the indicated genetic backgrounds were grown to mid-log phase, adhered to a ConA treated confocal dish, and imaged every 10 min over the course of 3 h. The time of cytokinesis was approximated by the “snapping off” motion of the daughter cell and repositioning adjacent to the mother cell (Yeh et al., 1995). Scale bar, 2 µm. (F) Quantification of the data from E. The PI(4)P enrichment ratio was measured as described in Fig. 5 I for individual cells at the three different cell cycle stages indicated. The error bars on the box and whisker plots extend to the minimum and maximum values while the box extends from the 25th to 75th percentiles. To determine statistical significance, an ordinary one-way ANOVA with multiple comparisons was used (n.s. = not significant, **** = P < 0.0001). All statistics are in comparison to the Original bud category for their respective genetic background. Data are from at least three movies per condition. (G) RID-Num1 cells expressing GFP-PHOsh2 were grown to mid-log phase, adhered to ConA treated confocal dish, and imaged before and every 10 min after treatment with DMSO or rapamycin. Scale bar, 2 µm. (H) Quantification of the data in G. The PI(4)P enrichment ratio was measured as described in Fig. 5 I 50 min after rapamycin treatment. Only cells that began with very small or no buds at the beginning of the movie were selected for analysis. The error bars on the box and whisker plots extend to the minimum and maximum values while the box extends from the 25th to 75th percentiles. To determine statistical significance, an unpaired t test was used (**** = P < 0.0001).

