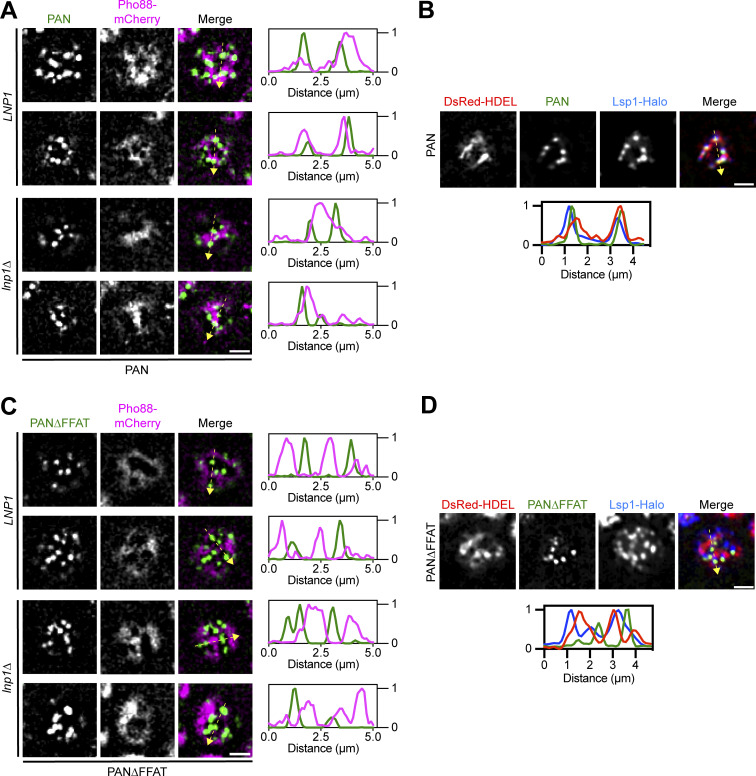
Figure S1.
Additional images of the ER and eisosomes in PAN and PAN∆FFAT cells. (A) Additional examples of PAN and the ER marker Pho88-mCherry in LNP1 and lnp1∆ cells (related to Fig. 2, C and D). Images are fluorescence micrographs from the top of the cell. Individual channels are shown in grayscale. Two examples from an LNP1 and lnp1∆ strain are shown. The dashed yellow arrow marks the location analyzed in the accompanying linescans to the right of the micrographs. Scale bar, 2 µm. (B) Fluorescence micrographs of cells expressing Lsp1-Halo and the ER marker DsRed-HDEL in PAN cells. Images are from the top of the cell. Individual channels are shown in grayscale. The dashed yellow arrow marks the location analyzed in the accompanying linescans. Scale bar, 2 µm. (C and D) Identical to A and B except PAN∆FFAT cells were imaged (related to Fig. 4, D and E).

