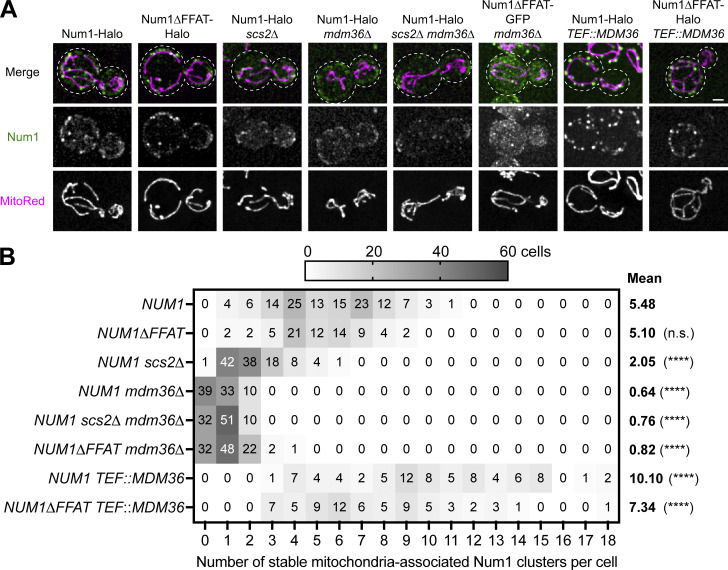
Figure S2.
Mdm36 is the primary determinant of the number and size of Num1 clusters. (A) Fluorescence micrographs of cells expressing the indicated Num1 fusion proteins with the mitochondrial matrix marker MitoRed in the indicated genetic backgrounds. Images are max projections of a full Z-stack. Individual channels are shown in grayscale. Dashed white lines represent cell outlines. The Num1 channels’ brightness/contrast settings were individually set to maximize the visualization of diffuse signals in the Mdm36 deletion strains, and the intensity between images should not be directly compared. Scale bar, 2 µm. (B) A heat map depicting the number of stable Num1-mediated mitochondrial tethering points per cell from the data set shown in A. A stable tethering point is defined as an accumulation of Num1 above background that persists for at least 1.5 min. See Materials and methods for a further description of the quantification methodology. The mean number of tethering points is indicated to the right of the heat map. Between 70 and 120 cells were counted per condition. To determine statistical significance, an ordinary one-way ANOVA with multiple comparisons was used (**** = P < 0.0001, n.s. = not significant). All statistical analyses are in comparison to NUM1.

