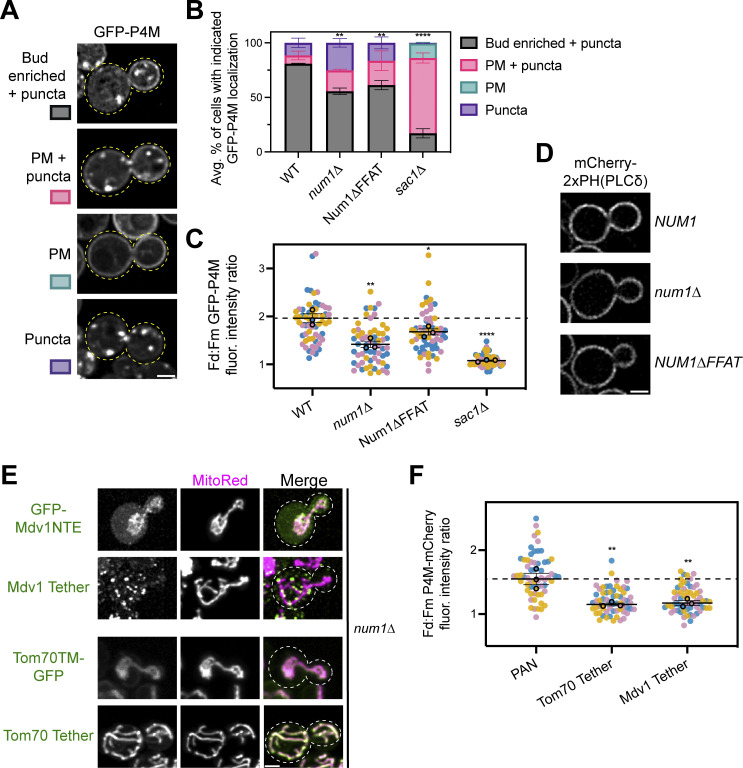
Figure S4.
PI(4)P, but not PI(4,5)P2, localization is altered upon loss of Num1, and synthetic mitochondria–PM tethers are not sufficient to restore PI(4)P polarization in the absence of Num1. (A) An array of representative fluorescence micrographs showing the different observed localization patterns for the PI(4)P biosensor GFP-P4M. The Bud enriched + puncta image is from a wild type strain, the PM + puncta and Puncta images are from a num1∆ strain, and the PM image is from a sac1∆ strain. Images are single slices from the center of the cell. Dashed yellow lines indicate cell outlines. Scale bar, 2 µm. (B) Quantification of the percentage of cells in the indicated genetic backgrounds showing the GFP-P4M localization patterns depicted in A. Quantification was performed identically to that done for the GFP-PHOsh2 biosensor in Fig. 5 H. To determine statistical significance, an ordinary one-way ANOVA with multiple comparisons was used (** = P < 0.01, **** = P < 0.0001). All statistical analyses are comparing the Bud enriched + puncta category to the WT condition. (C) Quantification of the ratio of GFP-P4M enrichment in daughter cells compared to mother cells using the strategy depicted in (Fig. 5 I). Quantification was performed and is presented identically to (Fig. 5 J). To determine statistical significance, an ordinary one-way ANOVA with multiple comparisons was used (* = P < 0.05, ** = P < 0.01, **** = P < 0.01). All statistical analyses are in comparison to the WT condition. The dashed line depicts the average GFP-P4M enrichment in wild type cells. (D) Representative fluorescence micrographs of cells of the indicated genetic backgrounds expressing the PI(4,5)P2 biosensor mCherry2xPH(PLCδ). Images are single slices from the center of a Z-stack. Scale bar, 2 μm. (E) Representative fluorescence micrographs showing the localization of GFP-Mdv1NTE, the Mdv1 Tether, Tom70TM-GFP, or the Tom70 Tether with the mitochondrial marker MitoRed. Individual channels are shown in grayscale. Images are max projections of a full Z-stack. Dashed white lines indicate cell outlines. Scale bar, 2 µm. (F) Quantification of the ratio of mCherry-P4M enrichment in daughter cells compared to mother cells using the strategy depicted in Fig. 5 G. Quantification was performed identically to that done for the GFP-PHOsh2 biosensor in Fig. 5 J except the dashed line depicts the average mCherry-P4M enrichment in PAN cells. The quantification for PAN cells is duplicated from Fig. 6 D to aid visual comparison. To determine statistical significance, an ordinary one-way ANOVA with multiple comparisons was used (** = P < 0.01). All statistical analyses are in comparison to the PAN condition.

