Figure S5.
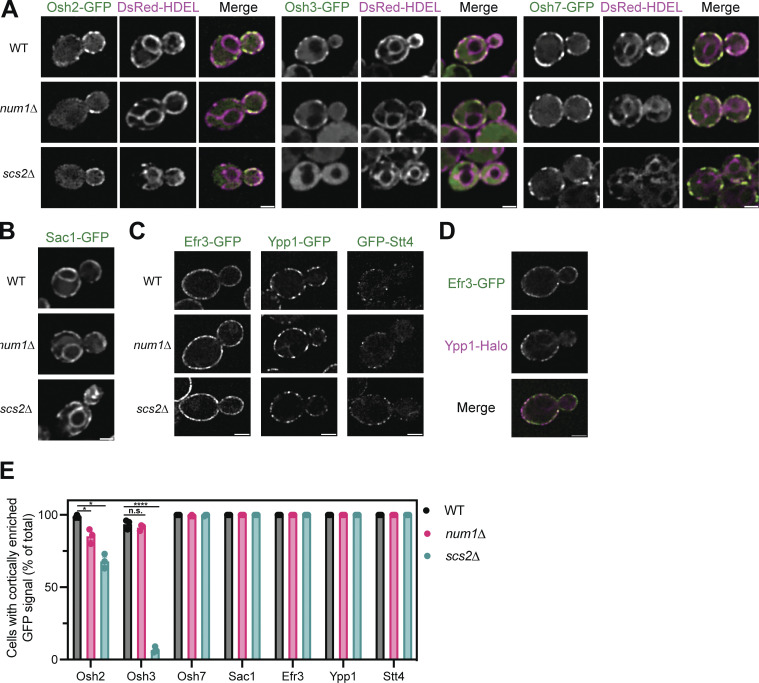
Determining the localization of Osh2, Osh3, Osh7, Sac1, Efr3, Ypp1, and Stt4 in num1∆ and scs2∆ mutants. (A) Fluorescence micrographs of yeast cells expressing Osh2-GFP, Osh3-GFP, or Osh7-GFP with the ER marker DsRed-HDEL in wild type, num1∆, or scs2∆ backgrounds. Osh2 and Osh7 are tagged at the genomic locus while Osh3 is expressed as a second copy from a CEN/ARS plasmid under control of the PHO5 promoter. Individual channels are shown in grayscale. Scale bar, 2 µm. (B) Fluorescence micrographs of cells expressing genomically tagged Sac1-GFP in wild type, num1∆, or scs2∆ backgrounds. Scale bar, 2 µm. (C) Super resolution fluorescence micrographs of cells expressing Efr3-GFP, Ypp1-GFP, or GFP-Stt4 in wild type, num1∆, or scs2∆ backgrounds. Efr3 and Ypp1 are tagged at the genomic locus while Stt4 is expressed as a second copy from a CEN/ARS plasmid under control of the CPY promoter. Scale bar, 2 µm. (D) Super-resolution fluorescence micrographs of cells expressing Efr3-GFP and Ypp1-Halo. Individual channels are shown in grayscale. Scale bar, 2 µm. (E) Quantification of the imaging data from A–D. For each protein in each genetic background, a central slice from a Z-stack was thresholded and manually scored for the presence of cortical enrichments of the indicated protein. Cortical enrichments were defined as punctate or elongated accumulations of fluorescent signal near the cell periphery. Each dot represents the average of one imaging replicate containing 100 cells. To determine statistical significance, an ordinary one-way ANOVA with multiple comparisons was used (* = P < 0.05, **** = P < 0.0001, n.s. = not significant).

