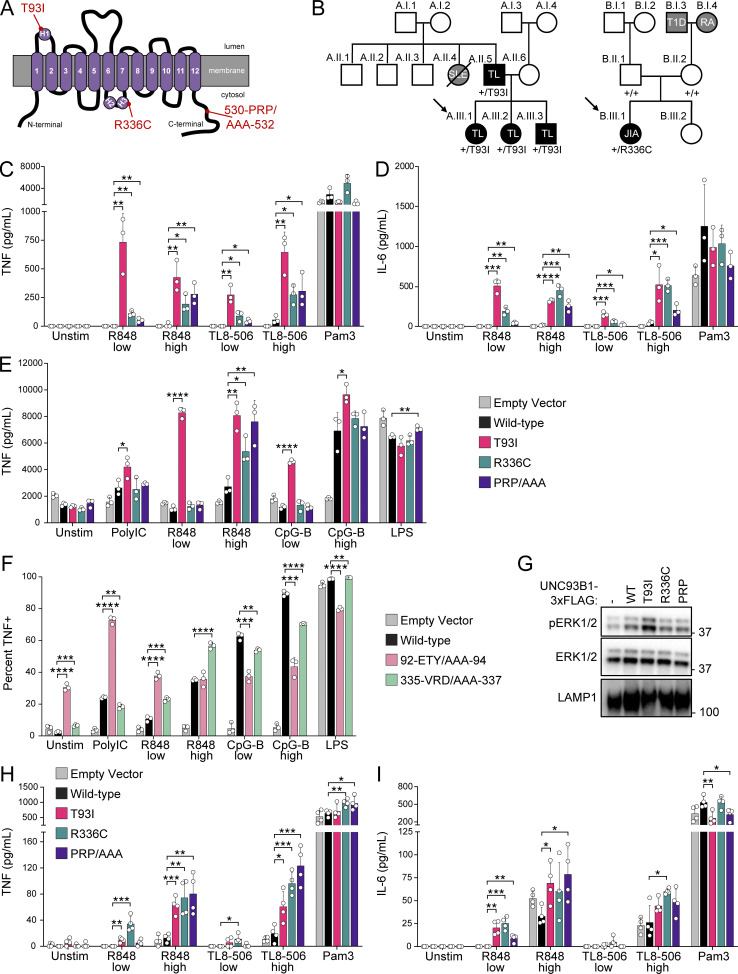
Figure 2.
Human UNC93B1 variants enhance endosomal TLR signaling. (A) Diagram of UNC93B1 depicting positions of the two human variants. H1, H2, and H3 indicate helices, as described in Fig. 1. (B) Pedigrees of families A and B with UNC93B1 variants. Squares, males; circles, females; horizontal lines connecting individuals and vertical nodes emanating therefrom represent parents and progeny, respectively; diagonal line crossing symbol represents the deceased individual. Black shading denotes autoimmune or inflammatory disease segregating with UNC93B1 genotype; gray shading denotes autoimmune or inflammatory disease in individuals who were not genotyped. Diagonal arrows denote sequenced probands, and UNC93B1 genotypes are listed below each symbol for all sequenced individuals. SLE, systemic lupus erythematosus; TL, tumid lupus; JIA, juvenile idiopathic arthritis; RA, rheumatoid arthritis; T1D, type 1 diabetes. (C and D) TNF (C) or IL-6 (D) production from PMA-differentiated human THP-1 cells (UNC93B1−/− clone D6) reconstituted with the indicated human UNC93B1 alleles and stimulated overnight with low R848 (1.3 µg ml−1), high R848 (4 µg ml−1), low TL8-506 (67 ng ml−1), high TL8-506 (200 ng ml−1), or Pam3CSK4 (10 ng ml−1). Cytokine production was measured in supernatants by LEGENDPlex assay. (E) TNF production from mouse RAW264.7 macrophages (Unc93b1−/−) reconstituted with the indicated human UNC93B1 alleles and stimulated for 8 h with Poly(I:C) (20 µg ml−1), low R848 (20 ng ml−1), high R848 (200 ng ml−1), low CpG-B (5 nM), high CpG-B (67 nM), or LPS (0.5 ng ml−1). Cytokine production was measured in supernatants by LEGENDPlex assay. (F) Triple-alanine UNC93B1 mutants from UNC93B1 mutagenesis screen corresponding to human UNC93B1 variants. Data show the percentage of TNF-positive cells determined by ICS of Unc93b1−/− RAW264.7 macrophages reconstituted with the indicated mouse Unc93b1 alleles and stimulated for 6 h with Poly(I:C) (20 µg ml−1), low R848 (4 ng ml−1), high R848 (10 ng ml−1), low CpG-B (45 nM), high CpG-B (100 nM), or LPS (5 ng ml−1). (G) Immunoblot demonstrating basal phospho-ERK1/2 levels in Unc93b1−/− RAW264.7 macrophages expressing the indicated human UNC93B1 variants. Data are representative of at least two independent experiments. (H and I) TNF (H) or IL-6 (I) production from PMA-differentiated wild-type human THP-1 cells (i.e., with intact endogenous UNC93B1 genes) ectopically expressing the indicated human UNC93B1 alleles, stimulated overnight with low R848 (1.3 µg ml−1), high R848 (4 µg ml−1), low TL8-506 (67 ng ml−1), high TL8-506 (200 ng ml−1), or Pam3CSK4 (10 ng ml−1). Cytokine production was measured in supernatants by LEGENDPlex assay. Data are mean ± SD of (C–F) triplicate or (H and I) quadruplicate technical replicates, representative of at least two independent experiments. P value determined by unpaired two-tailed Student’s t test: *P ≤ 0.05, **P ≤ 0.01, ***P ≤ 0.001, ****P ≤ 0.0001. Source data are available for this figure: SourceData F2.

