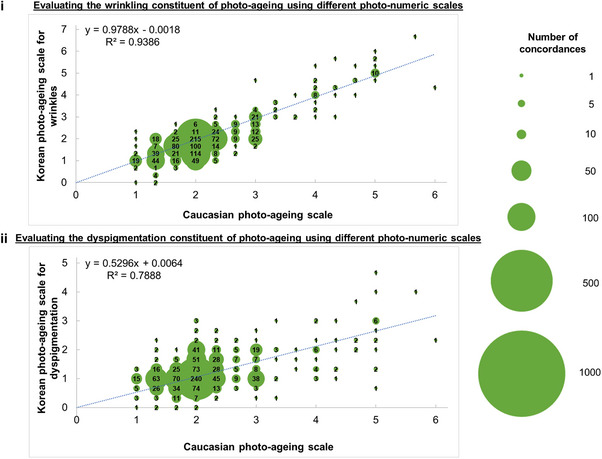
FIGURE 1.

(i) Bubble plots compare the Caucasian photo‐ageing scale and the Korean photo‐ageing scales for wrinkles. Means are calculated from three assessors. Larger circles indicate greater concordance between the two scales. Numbers in the circles are the number of concordances. The sample size of each plot is 1,081 participants. (ii) Bubble plots compare the Caucasian photo‐ageing scale and the Korean photo‐ageing scales for dyspigmentation. Means are calculated from three assessors. Larger circles indicate greater concordance between the two scales. Numbers in the circles are the number of concordances. The sample size of each plot is 1,081 participants.
