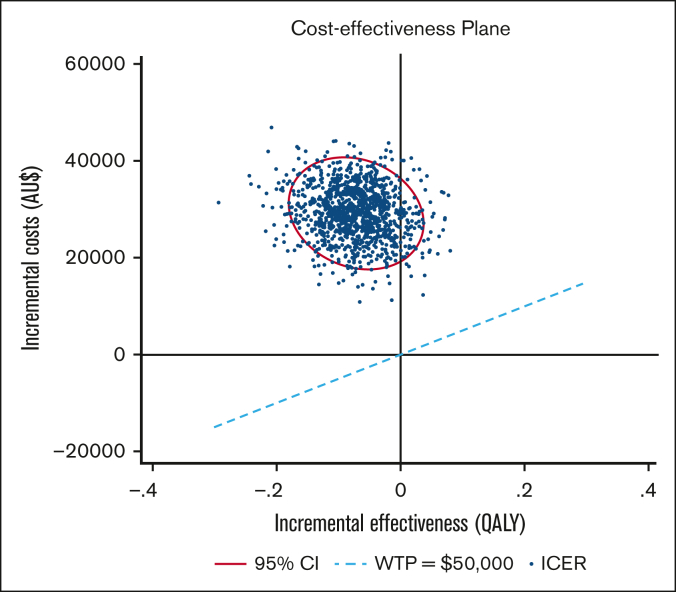
Figure 2.
Cost-effectiveness plane Ig vs antibiotics. PSA. The ellipse represents the 95% CI around the ICER points, calculated via bootstrap (1000 iterations). The ICER scatter lies over the WTP line of AU$50 000 per QALY, indicating prophylactic Ig is less effective and more costly than antibiotics in this population and at that WTP threshold.

