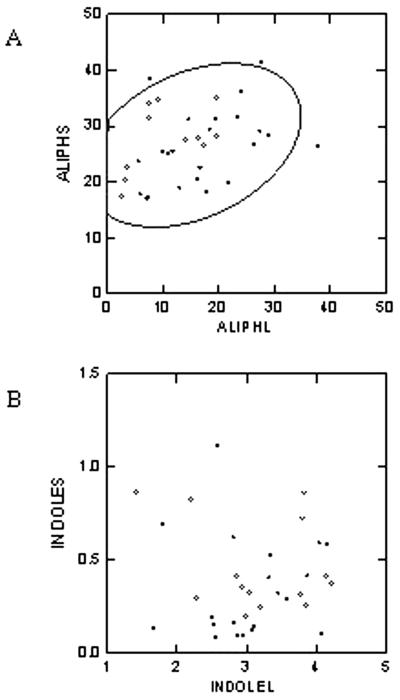
Figure 5.
Correlation of glucosinolate accumulation between the leaves and seeds. A, Scatter plot depicting the relationship between aliphatic glucosinolate accumulation in leaves (ALIPHL) and seeds (ALIPHS) of the ecotypes tested. The 90% confidence ellipse interval is drawn for reference. The values are in μmol g dry weight−1. B, Scatter plot depicting the relationship between indolic glucosinolate accumulation in the leaves (INDOLEL) and seeds (INDOLES) of the ecotypes tested. The values are in μmol g dry weight−1.

