Figure 1. .
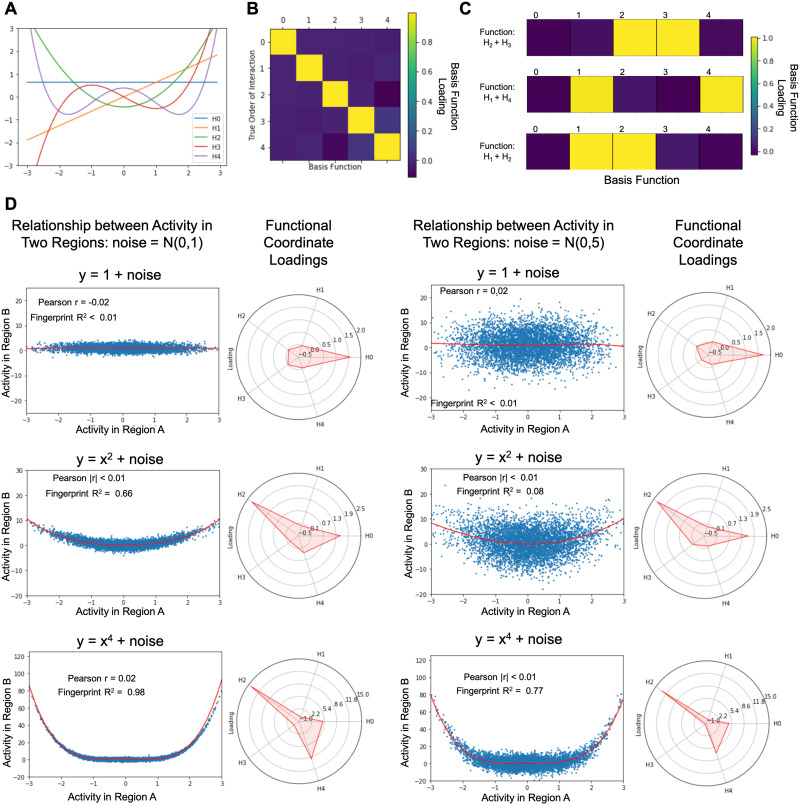
Validation with synthetic data. (A) The first five Hermite polynomials. (B) Functional coordinates identify the underlying relationship between two sets of simulated data. We generated five sets of x-y pairs where the true relationship between each subsequent pair of x and y is one of the first five Hermite polynomials (ex. y1 = H1(x1)). As expected, the coordinate estimates assign coefficients near 1 to the polynomial in the basis set that defines the relationship between x and y, and coefficients near 0 to all others. (C) When the simulated data are generated using a linear combination of two basis functions (ex. y1 = H1(x1) + H2(x1)), the resulting functional coordinates reveal loadings near 1 for each contributing basis function, and loadings near zero for all other basis functions. (D) Nonlinear coordinates can approximate U-shaped interactions that would be indistinguishable using standard correlation analysis. We generated synthetic data where the relationship between activity in Region A and activity in Region B have a symmetric relationship (y = 1 + noise, y = x2 + noise, and y = x4 + noise). A range of noise was simulated by drawing from two normal distributions with mean 0 and standard deviation 1 and 5, respectively. The estimated function is plotted in red and the loadings on the functional coordinates are illustrated in radar plots alongside each graph.

