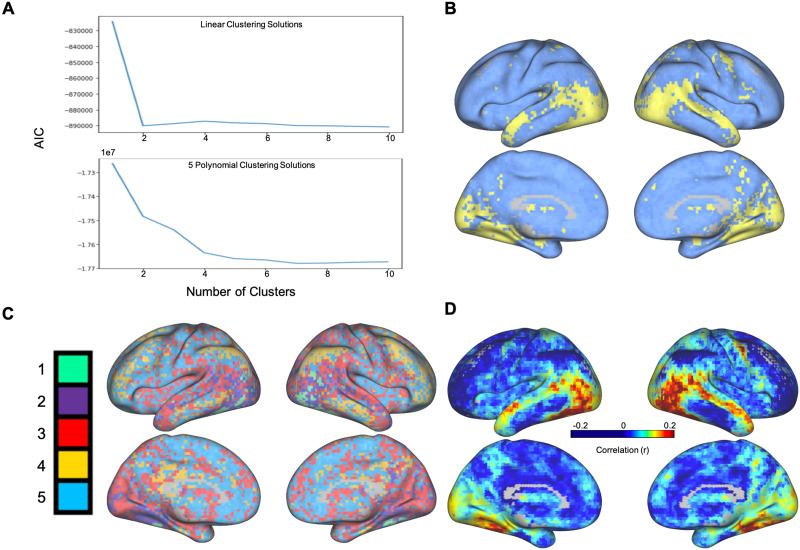
Figure 2. .
(A) Using k-means clustering, as the number of clusters (k value) increases, the Akaike information criterion (AIC) values decrease. The optimal clustering solution occurs when the AIC stops substantially decreasing. Top: Linear functional coordinates (Hermite polynomials of degree 1). The elbow occurs at k = 2 clusters, meaning the optimal number of clusters across linear coordinates is 2. Bottom: Nonlinear functional coordinates (Hermite polynomials of degree 0 through 4). The elbow occurs at k = 5 clusters. (B) Visualization of the cluster assignments of different voxels based on the linear functional coordinates. For each voxel, we used the mode cluster assignment across subjects to determine that voxel’s final cluster value. Each cluster is represented by a different color, and the intensity of the color represents the percentage of subjects sharing that voxel’s cluster assignment (lighter colors denote a higher percentage). (C) Visualization of the cluster assignments of different voxels based on the nonlinear functional coordinates (generated with the same approach described in panel B). There was no difference in the clustering solution using all five basis vectors and when excluding the 0th-order basis vector. (D) Functional connectivity was calculated between the FFA and each individual voxel for all subjects. After averaging the correlation values across all subjects, we plotted the resulting average correlation values across the cortex. The pattern of functional connectivity with the FFA illustrates the highest correlations with regions spanning the ventral, and dorsal temporal lobe and much of the visual cortex. These results parallel clustering solution using linear coordinates.

