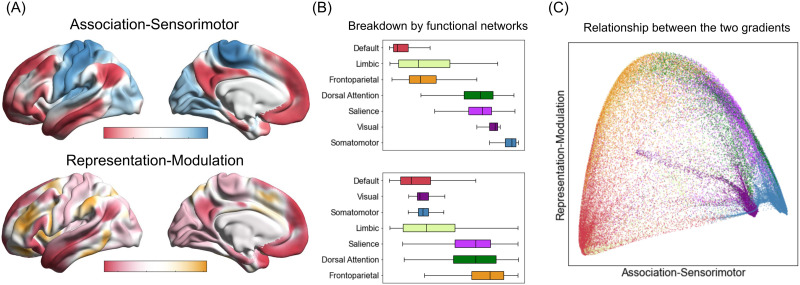
Figure 3. .
Two of the dominant functional connectivity gradients identified in the cerebral cortex. (A) For each connectivity gradient, the proximity of colors can be interpreted as greater similarity of connectivity patterns between a pair of cortical vertices. (B) Boxplots show medians and interquartile ranges of gradient values in canonical functional networks (Yeo et al., 2011), ordered by median values. Conventional network labels are used here, but note that “default” and “limbic” networks are not always distinguished in the literature (e.g., Kong et al., 2019) and both contain agranular, limbic tissue (Kleckner et al., 2017). (C) A scatterplot illustration of the two connectivity gradients. Colors correspond to those used in panel B to depict functional networks.

