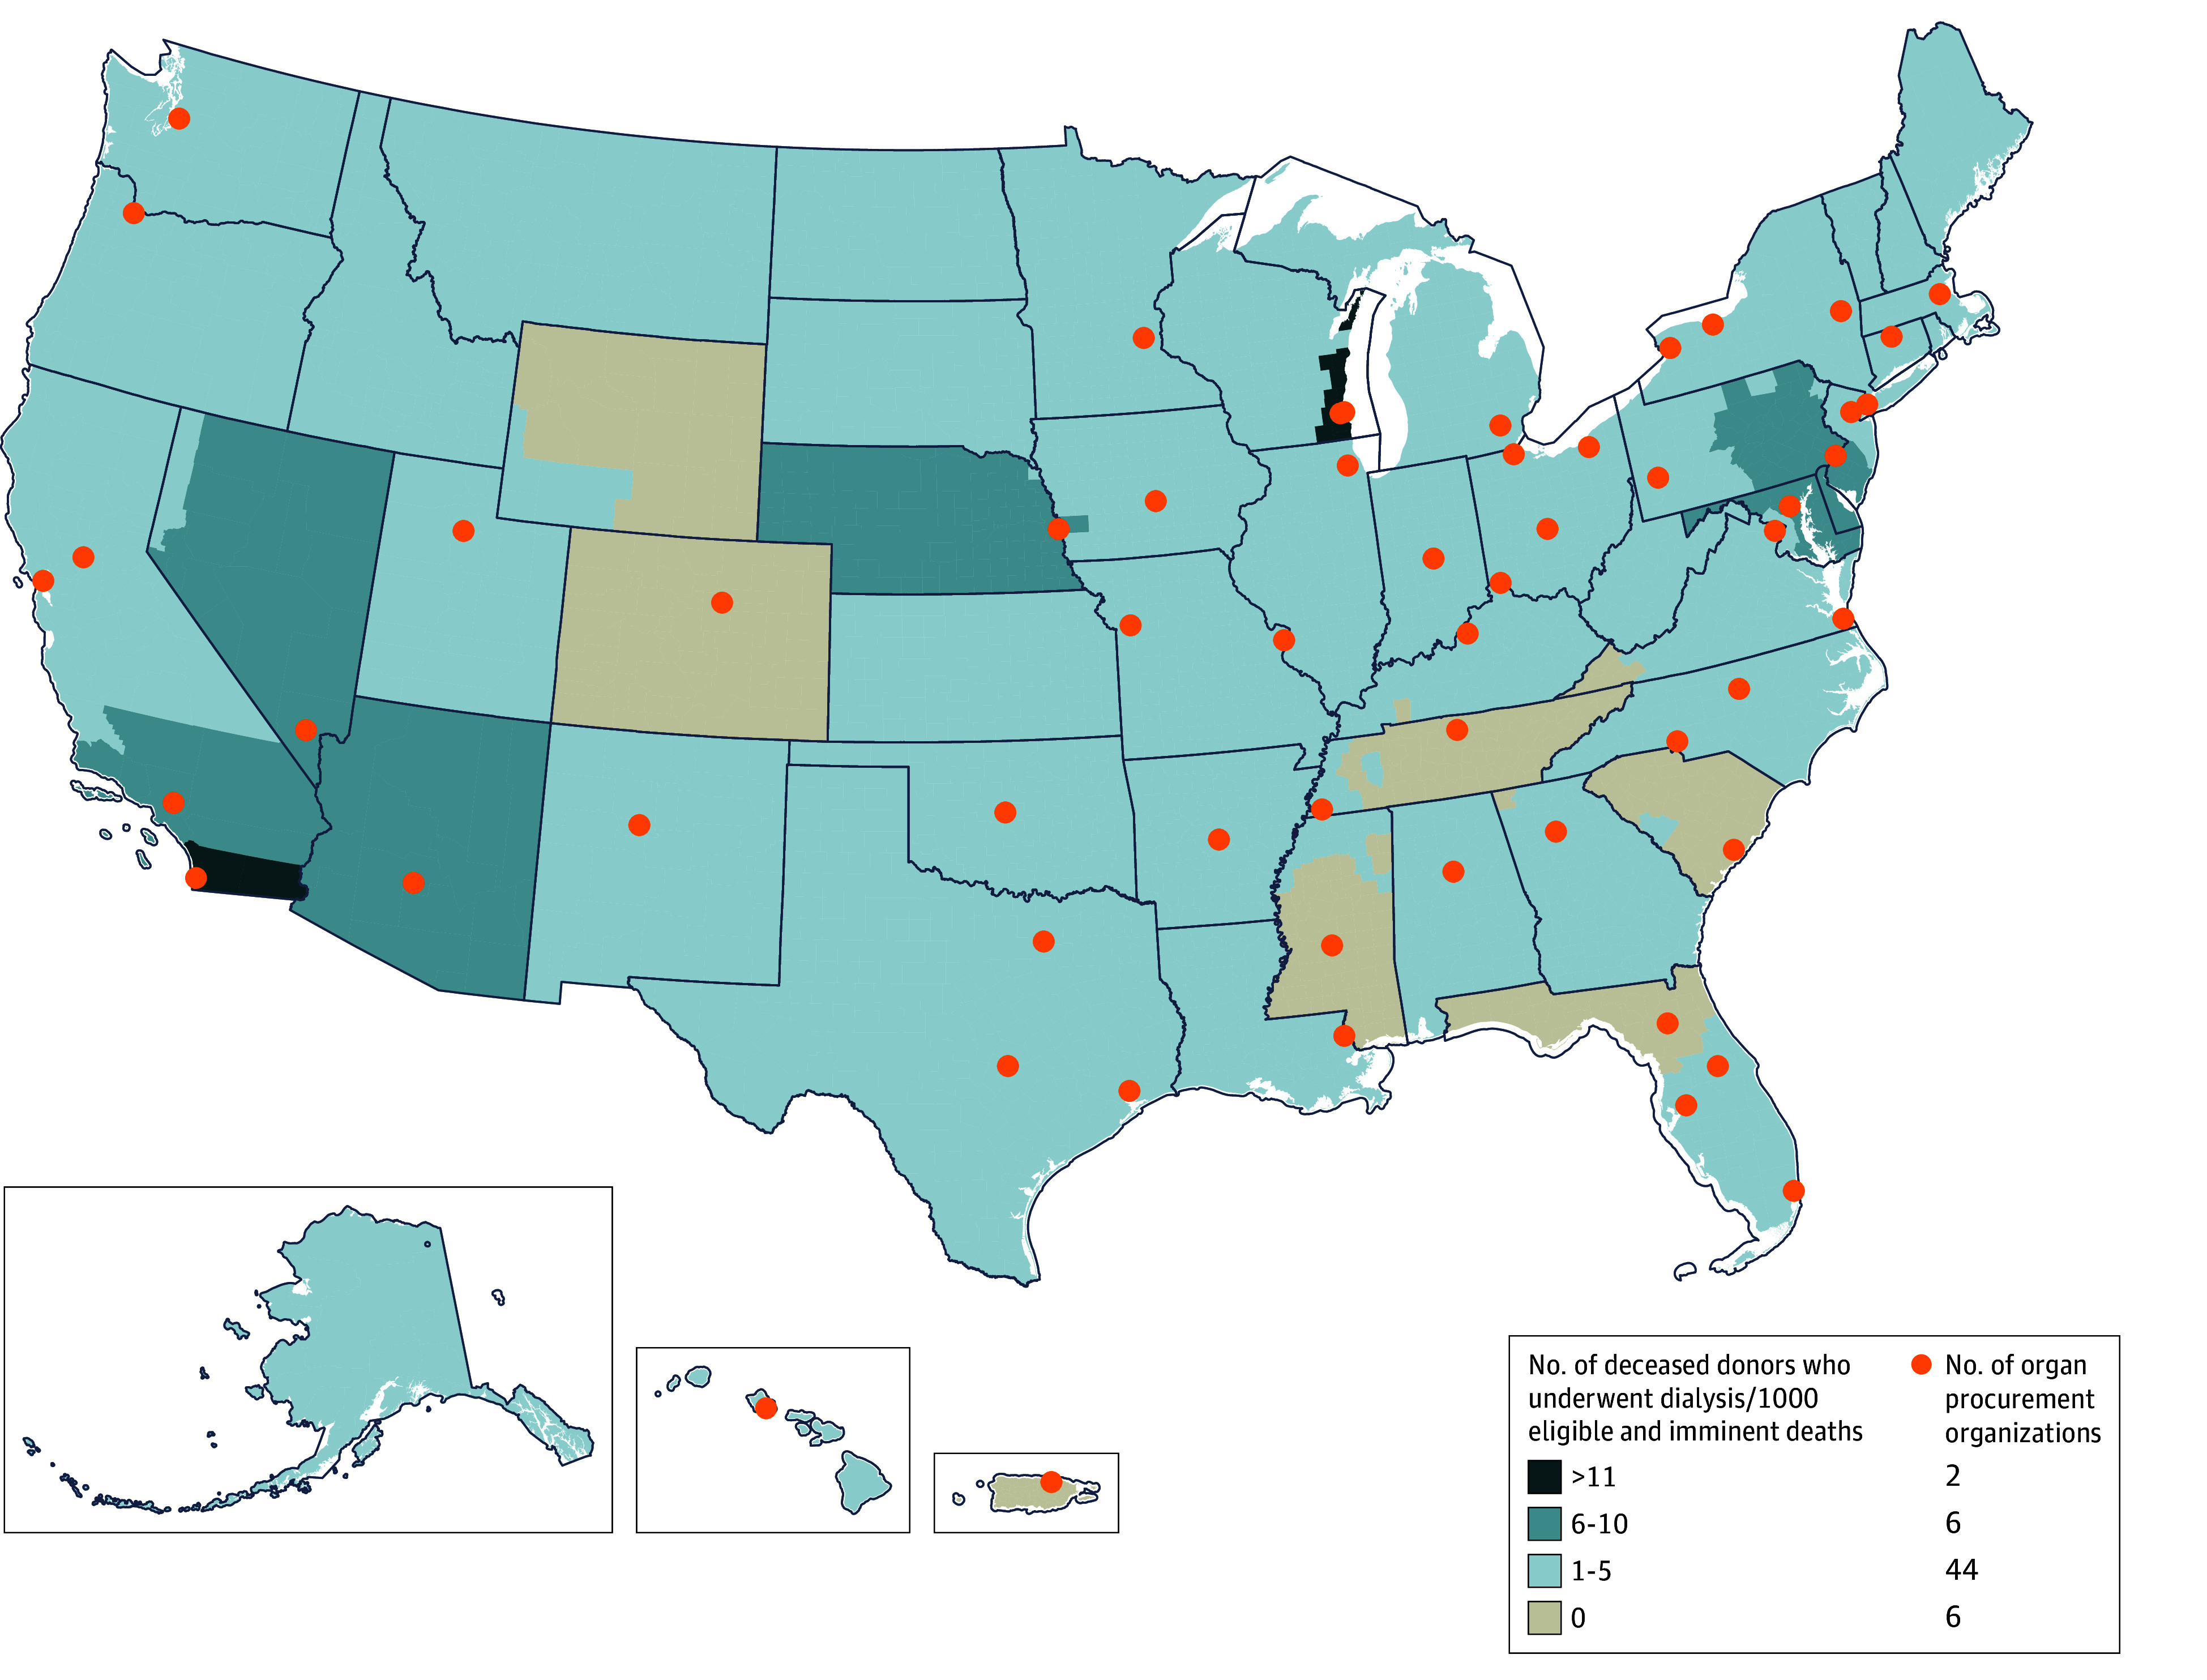
Figure 2. Geographic Variation in Kidney Transplants From Deceased Donors Who Underwent Dialysis Across 58 Donation Service Areas in the US From 2010 to 2018.

Geographical heat map depicting rates and locations of kidneys transplanted from deceased donors who underwent dialysis during their final hospitalization.
