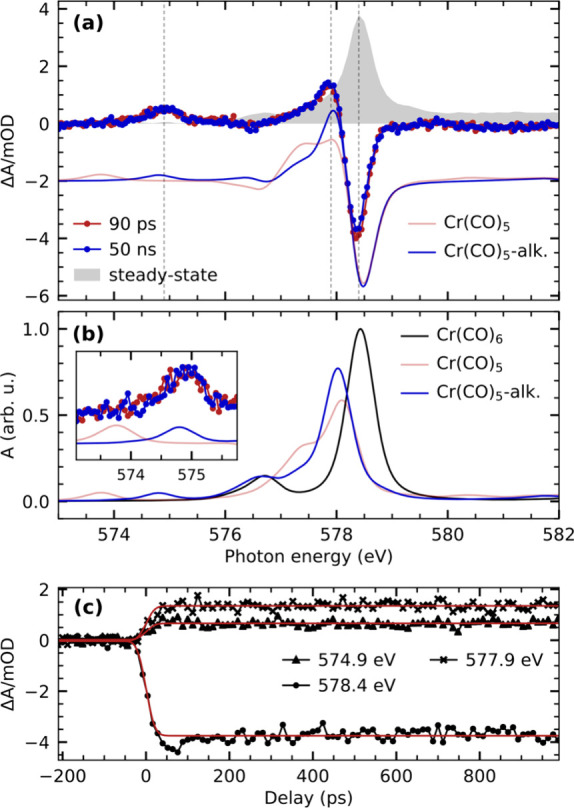
Figure 5.

(a) Experimental and calculated transient Cr L3-edge absorption difference spectra of Cr(CO)6 in octane solution. Calculations are performed at the RASSCF level of theory. Difference spectra of the Cr(CO)5-alkane σ-complex and the Cr(CO)5 fragment are generated with respect to Cr(CO)6 (spectrum of the respective species minus spectrum of Cr(CO)6). For better comparison, the depletion of the calculated Cr(CO)5-alkane difference spectra is scaled to match the depletion of the experimental spectrum, and the Cr(CO)5 difference spectrum is scaled accordingly. The experimental steady-state spectrum is additionally shown for comparison and scaled to match the amplitude of the depletion of the transient difference spectra. (b) Calculated L3-edge absorption spectrum of Cr(CO)6, the Cr(CO)5-alkane σ-complex, and the Cr(CO)5 fragment. The maximum of the Cr(CO)6 spectrum is scaled to 1, and the other spectra are scaled accordingly. The inset shows a close-up of the transient pre-edge region between 573.1 and 575.75 eV. (c) Pump–probe delay traces measured at the energies indicated in (a). The delay traces are modeled with a step function broadened by a Gaussian function.
