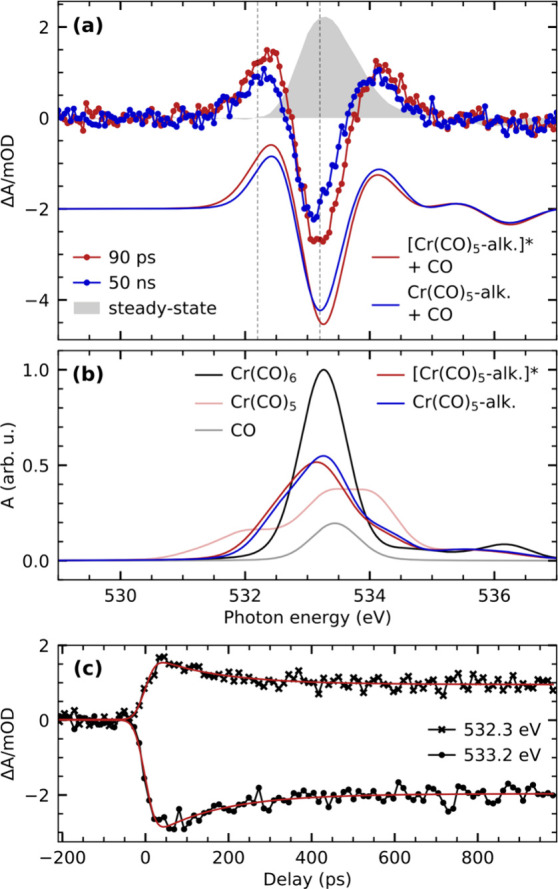
Figure 6.

(a) Transient O K-edge absorption difference spectra of Cr(CO)6 in octane solution compared with calculated difference spectra of the Cr(CO)5-alkane σ-complex and the free CO as well as the Cr(CO)5 fragment and the free CO with respect to the Cr(CO)6 species. The depletion of the calculated difference spectrum, which represents the sum of the Cr(CO)5-alkane σ-complex and the free CO, is scaled to match the depletion of the experimental spectrum at 50 ns. The calculated difference spectrum of the “hot” [Cr(CO)5-alkane]* σ-complex plus the free CO is scaled accordingly. The generation of the “hot” [Cr(CO)5-alkane]* σ-complex spectrum is discussed in the main text. The experimental steady-state spectrum is additionally shown for comparison and scaled to match the amplitude of the depletion of the transient difference spectrum at 50 ns. (b) Calculated O K-edge absorption spectra of all species considered in generating the difference spectra displayed in (a). The maximum of the Cr(CO)6 spectrum is scaled to 1. All other spectra are scaled accordingly. (c) Pump–probe delay traces measured at the energies indicated in (a). The delay traces are modeled with a single-exponential decay of a primary species to a stable product.
