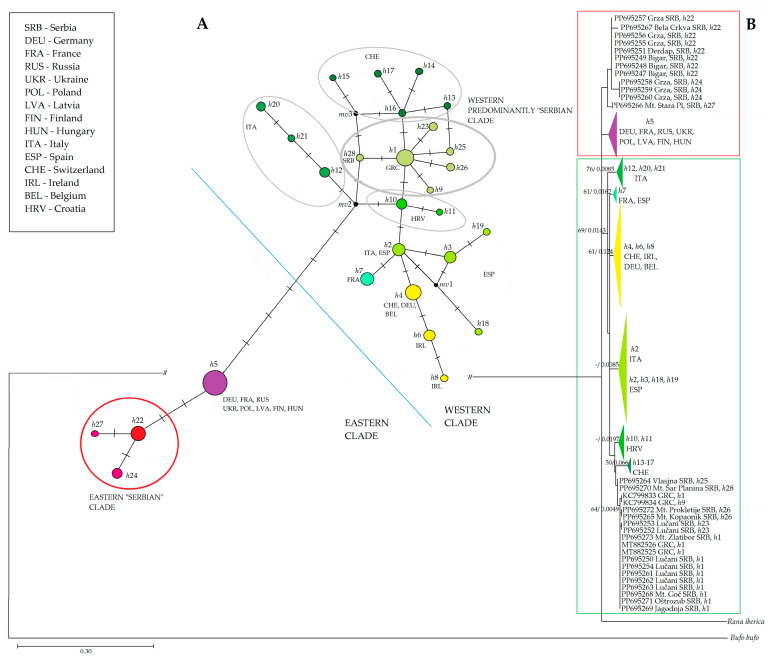
Figure 4.
Phylogenetic trees inferred from MT-CYTB nucleotide comparison. (A): Median Network tree generated using NETWORK software represents connections among all 28 haplotypes from MT-CYTB dataset. Node size corresponds to a sample number of a specific haplotype; mv—a hypothesized, often ancestral, sequence required to connect existing sequences within the network with maximum parsimony. Transverse lines represent one nucleotide change. (B): ML phylogenetic tree with bootstrap values presented beside the nodes. Some sample sequences belonging to the same haplotype have been condensed into haplotype groups for better visibility and their color corresponds to the color of the nodes in the MJ network tree. Support values of both methods (ML and BI) are placed at the nodes in that order. The dash indicates branch support <50. Red square—Eastern Clade; green square—Western Clade.

