
Figure 4.
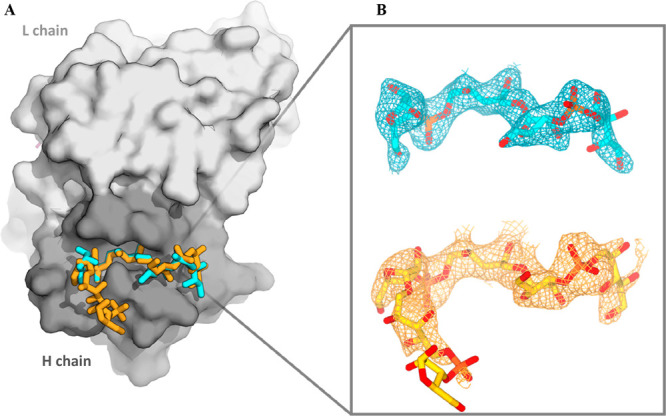
A) Superposition of the Fab CA4/DP2 and Fab CA4/DP3 X-ray structures. The Fab is shown as a surface with a gray H chain and a white L chain, and the two OS fragments are shown as sticks (DP2-cyan and DP3-yellow). B) Final (2Fo – Fc) electron density maps of DP2 and DP3 OS were contoured at 1.5σ. OS structures are represented as sticks colored by elements (C atom in cyan/yellow, P atom in orange, and O atom in red).