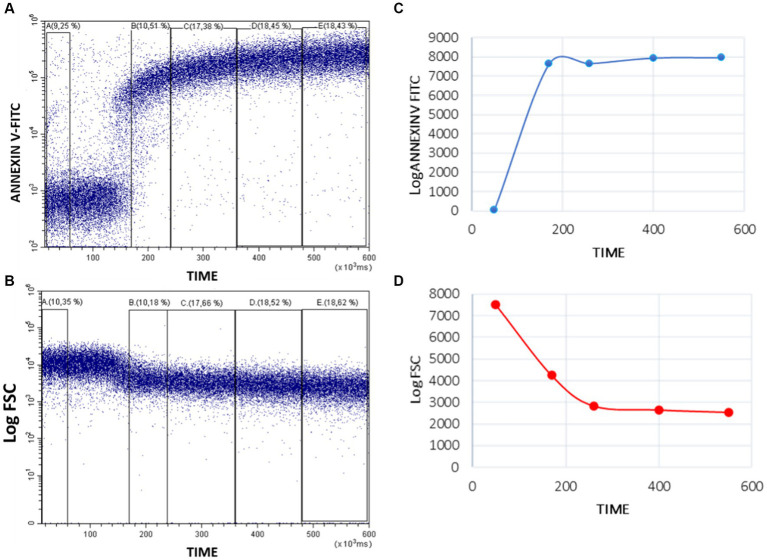
Figure 3.
Quantitative analysis of Annexin-V-FITC binding and FSC decrease in whole blood platelets after activating Bottlenose dolphin platelets in a whole blood sample with calcium ionophore A23187. Five regions (A–E) were defined over the Time axis in Annexin V-FITC/Time (A) and FSC/Time kinetic plots (B) and the mean intensity values obtained with the CytExpert software. The resulting values were represented in standard kinetic graphs displaying in arbitrary units (Y-axes) the mean fluorescence intensity (Annexin-V-FITC) (C) and the mean scatter intensity (Log FSC) variations along time (D).

