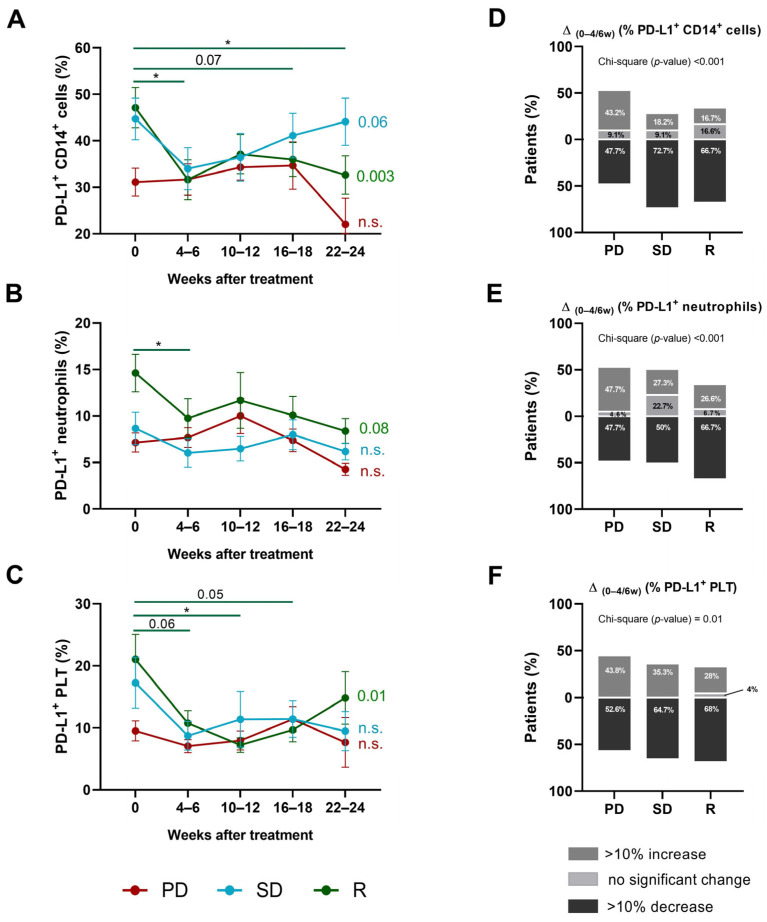
Figure 2.
Kinetics of PD-L1+ CD14+ cells, PD-L1+ neutrophils, and PD-L1+ platelets in NSCLC patients based on anti-PD-(L)1 response. Percentages of (A) PD-L1+ CD14+ cells, (B) PD-L1+ neutrophils, and (C) PD-L1+ platelets during 24 weeks of anti-PD-(L)1 treatment in PD (red line), SD (blue line), and R patients (green line). p-values from one-way ANOVAs for each of the three groups are displayed on the right side of each graph, and significant differences between successive time intervals are analyzed by Tukey post hoc comparisons and marked with a line. Changes (>10% decrease (black), no significant change (with less than a 10% change) (light grey), and >10% increase (dark grey)) in the percentages of (D) CD14+ cells, (E) neutrophils, and (F) platelets in the first 4–6 weeks of anti-PD-(L)1 treatment. (*) p < 0.05; n.s. is not significant.

