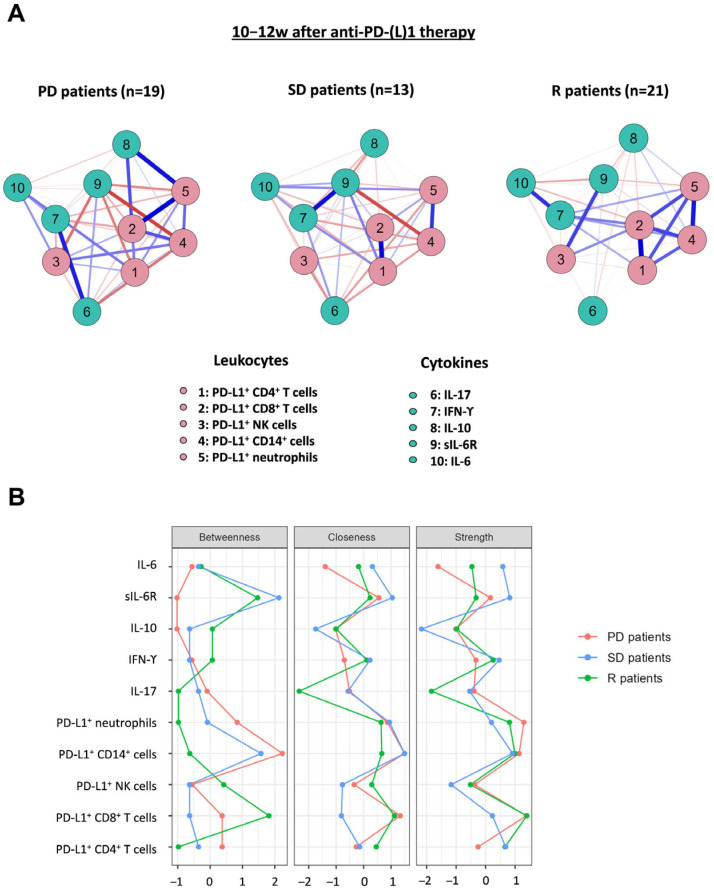
Figure 5.
Network diagrams and centrality plots for NSCLC patients treated with anti-PD-(L)1-response at baseline and after 10–12 weeks of treatment. (A) Network model of leukocytes and cytokines interactions in PD (n = 19), SD (n = 13), and R (n = 21) NSCLC after 10–12 weeks of anti-PD-(L)1 therapy. Blue lines represent positive associations, and red lines negative associations. Thicker lines indicate stronger associations. Red nodes represent PD-L1+ leukocyte populations and the green ones represent plasma cytokines. Network diagrams were estimated by correlation method. (B) Centrality indices for the network nodes. The x-axis is the raw values of centrality indices and the y-axis represents all the nodes.

