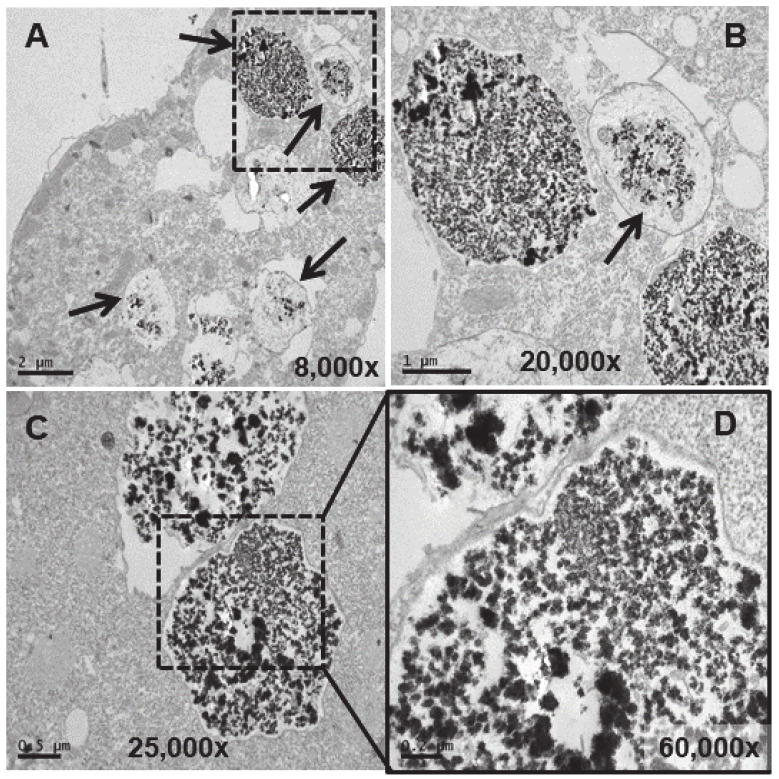
Figure 6.
TEM images of cells treated with EuCl3 (2 mM, 24 h treatment). (A): Vacuoles with different levels of electrodense granular material bioaccumulation (arrows). (B): Magnification of the region (delimited by the square with the dashed line) in panel (A). (C): Vacuoles with granular electrodense material. (D): Magnification of the region (delimited by the square with the dashed line) in panel (C).

