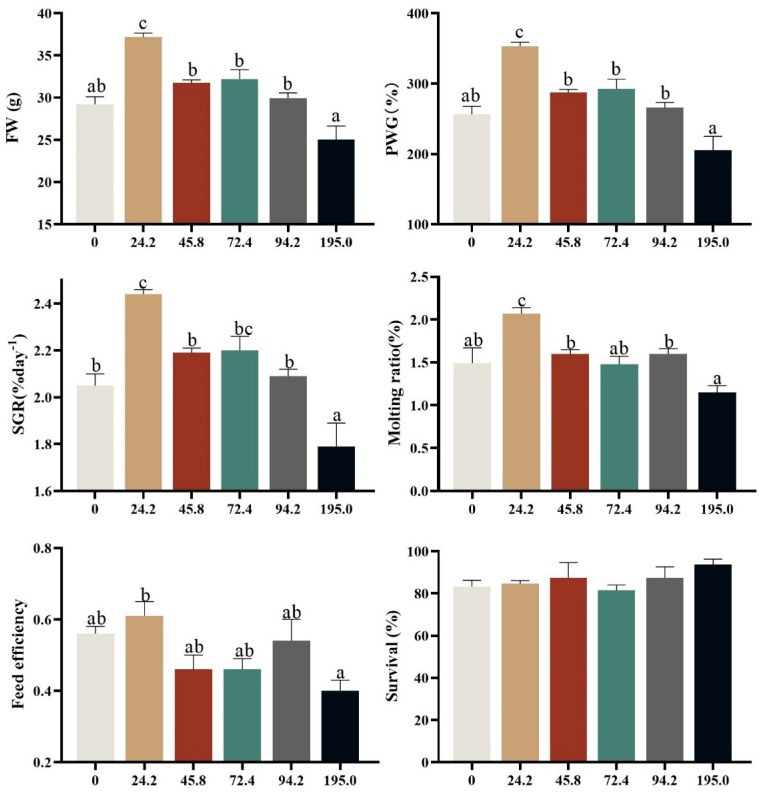
Figure 2.
Growth performance, survival and molting rate of Portunus trituberculatus fed different AST levels. Data are presented as means ± SEM of three replicates. Mean values in the same row with different superscript letters are significantly different (p < 0.05). FW, final weight; PWG, percent weight gain; SGR, specific growth rate; MR, Molting ratio.

