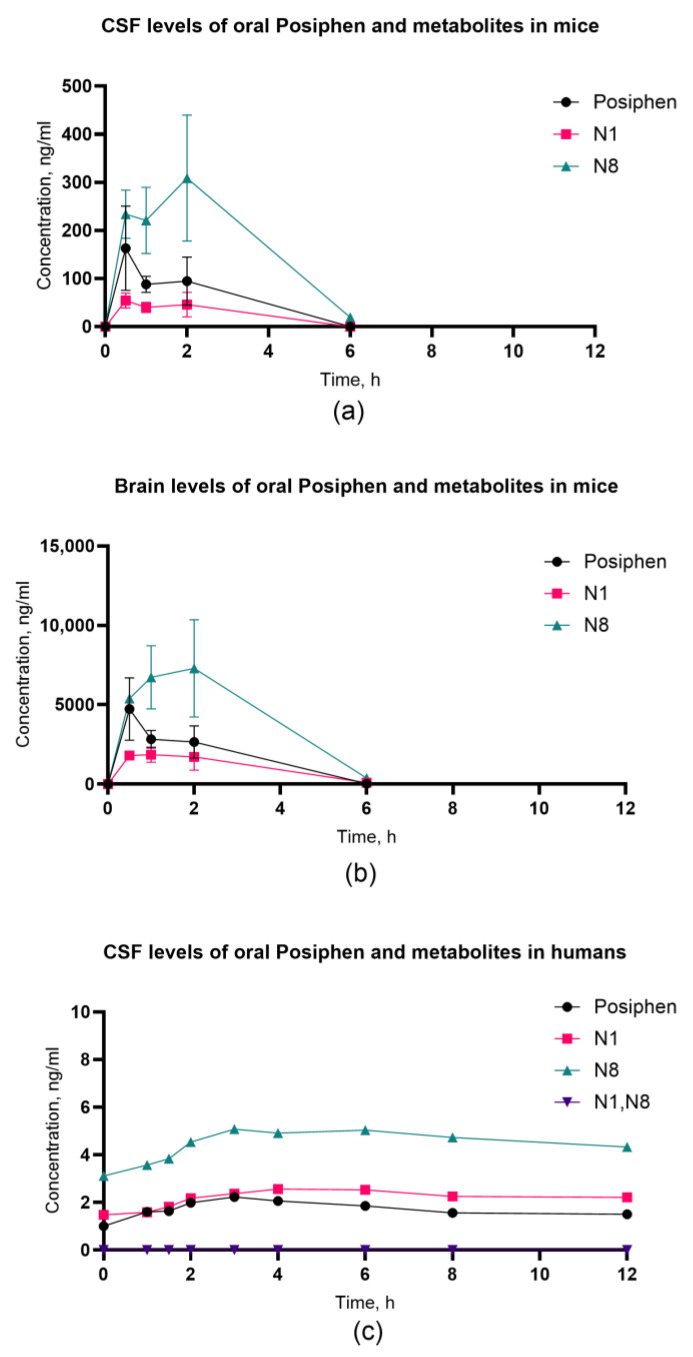
Figure 4.
Plasma concentrations of oral Posiphen and metabolites presented as Cmax mean values with standard deviation (SD) in mice (n = 7)—(a) CSF; (b) brain—and in humans (n = 4)—(c) CSF. The SD and %CV values for each time point in mice are described in Supplementary Materials S2. Due to the low sample size for humans, the study was underpowered to perform SD calculations.

