Figure 3.

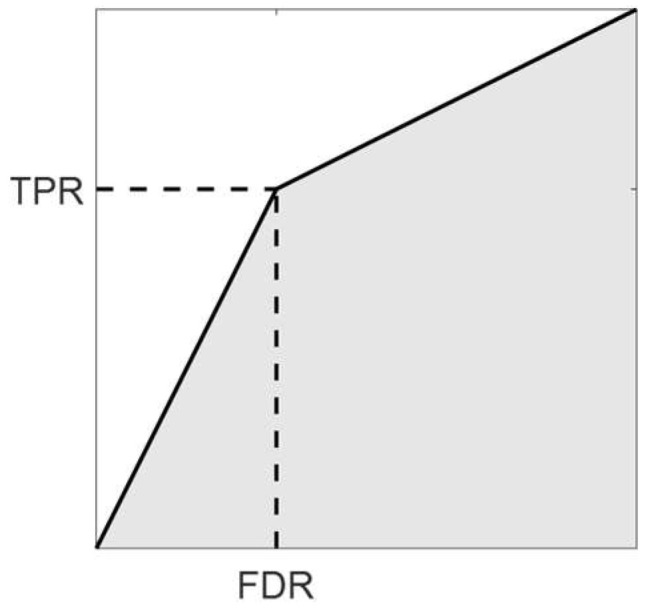
The area under curve (AUC, the shaded region) for the true positive rate (TPR) against false detection rate (FDR) can be approximated as the average of TPR and PPV at an instance of detection threshold.

The area under curve (AUC, the shaded region) for the true positive rate (TPR) against false detection rate (FDR) can be approximated as the average of TPR and PPV at an instance of detection threshold.