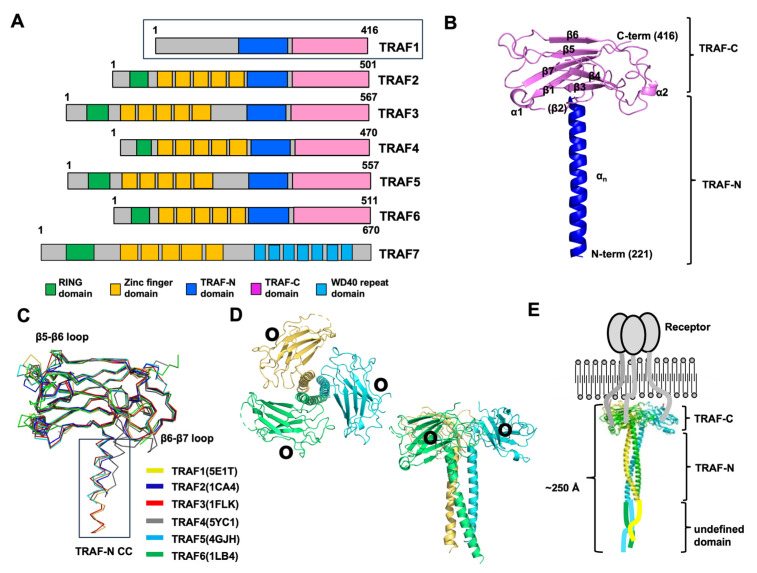
Figure 1.
An overview of the various aspects of the TRAF family structure focusing on TRAF1. (A) The domain boundary in the TRAF family, showing the regions where specific functional domains are located. (B) Representative cartoon figure showing the monomeric TRAF domain. The structure of TRAF1 (PDB ID: 5E1T) was used as a representative example [31]. The color gradient, transitioning from blue to red, illustrates the chain orientation from the N to C terminus, and secondary structures such as helices and sheets are labeled. (C) The superposition of the structures of the TRAF domain, likely showing the structural alignment of TRAF domains from different TRAF family members. PDB IDs are presented next to the name of each protein. (D) A cartoon of the trimeric TRAF1 TRAF domain. Each chain is shown separately in distinct colors, providing a clear visual representation of the trimeric structure. The illustration offers both top and side views. Within the structure, black circles are utilized to highlight the receptor-binding region, emphasizing its importance in molecular interactions. (E) A full-length structural model depicted alongside a schematic representation illustrating the interaction between TRAF1 and its receptor.

