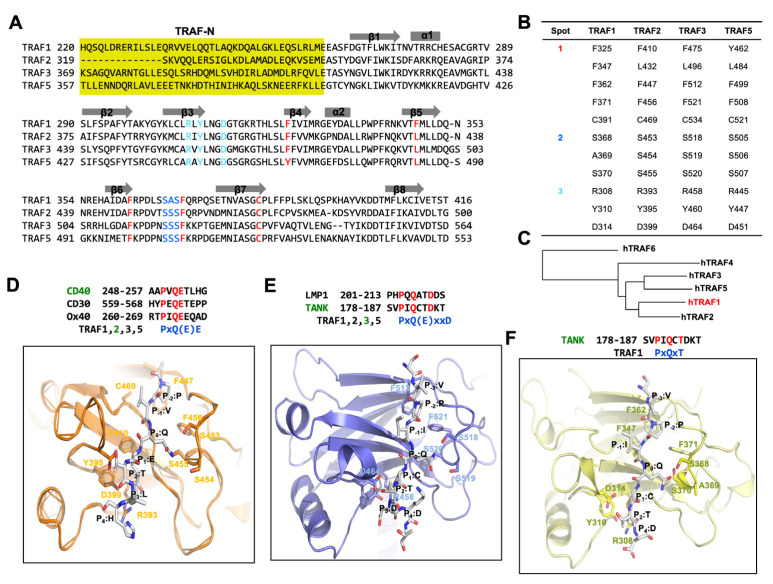
Figure 2.
Deciphering the TRAF-binding motif through structural insights from TRAF/receptor complexes, focusing on the case of TRAF1. (A) Sequence alignment of TRAF1, TRAF2, TRAF3, and TRAF4 shows the conserved receptor-binding hot spots. The residues involved in the formation of binding hot spots 1, 2, and 3 are colored in red, blue, and cyan, respectively. (B) Table summarizing the binding hot-spot-forming residues. (C) Phylogenetic tree of TRAF domains from different TRAF families. h indicates human protein. Phylogenetic tree was generated using NCBI tree viewer: https://www.ncbi.nlm.nih.gov/tools/treeviewer (accessed on 25 March 2024). (D) A magnified view of a CD40-TRAF2 complex (PDB ID: 1D00) [39]. (E) A magnified view of a TANK-TRAF3 complex (PDB ID: 1L0A) [41]. (F) A magnified view of a TANK-TRAF1 complex (PDB ID: 5H10) [42].

