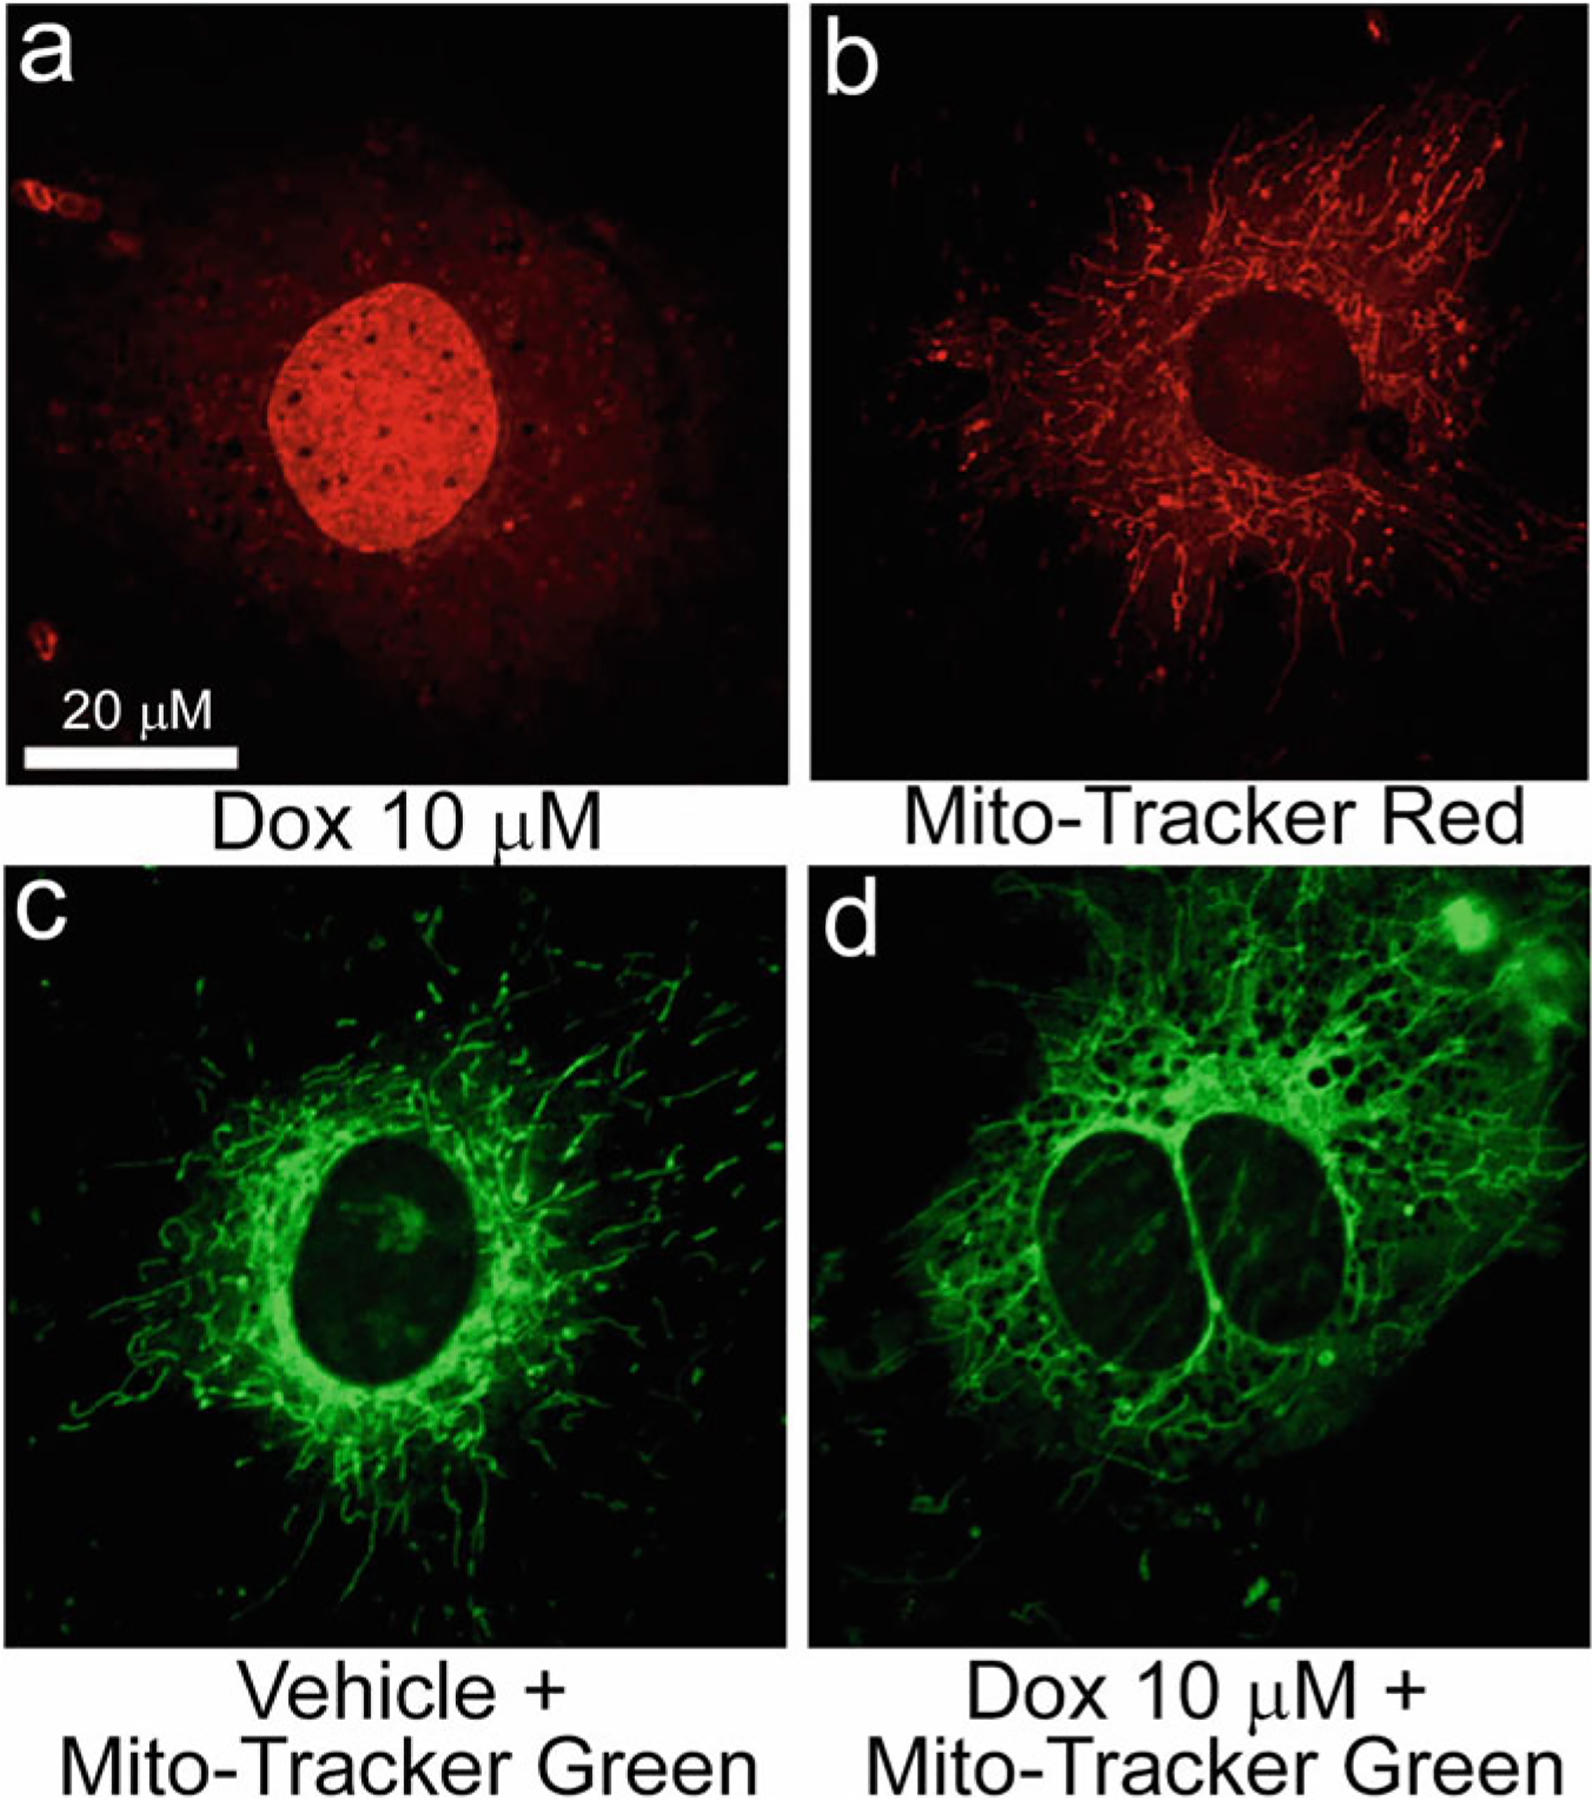
Fig. 1.

Monitoring mitochondrial network organization and morphology in cardiomyocytes. Representative confocal fluorescence microscope images demonstrating Dox alone (a), MitoTracker® Red alone (b), and MitoTracker® Green (c, d) labeled neonatal rat cardiomyocytes. (a) DOX (red) accumulates at subcellular locations as appeared as fluorescent dots in the cytosol and diffuse accumulation in the nucleus of cardiomyocytes following DOX-treatment (10 μM, 24 hours). (b) MitoTracker® Red staining reveals mitochondrial network (red) as appeared in a blend of fragmented, short tubular, and long tubular forms. Hence, we do not recommend the use of MitoTracker Red dyes to use in DOX-treated cells to avoid potential overlap between them in captured fluorescence images which may lead to erroneous interpretation of the data (please see Note 5 for explanation). (c, d) MitoTracker® Green staining reveals a mixture of a fragmented, short, and long tubular network of mitochondria (green) in vehicle (c) treated cardiomyocytes while DOX treatment (10 μM, 24 hours) resulted in hyperfused tubular mitochondrial network in cardiomyocytes
