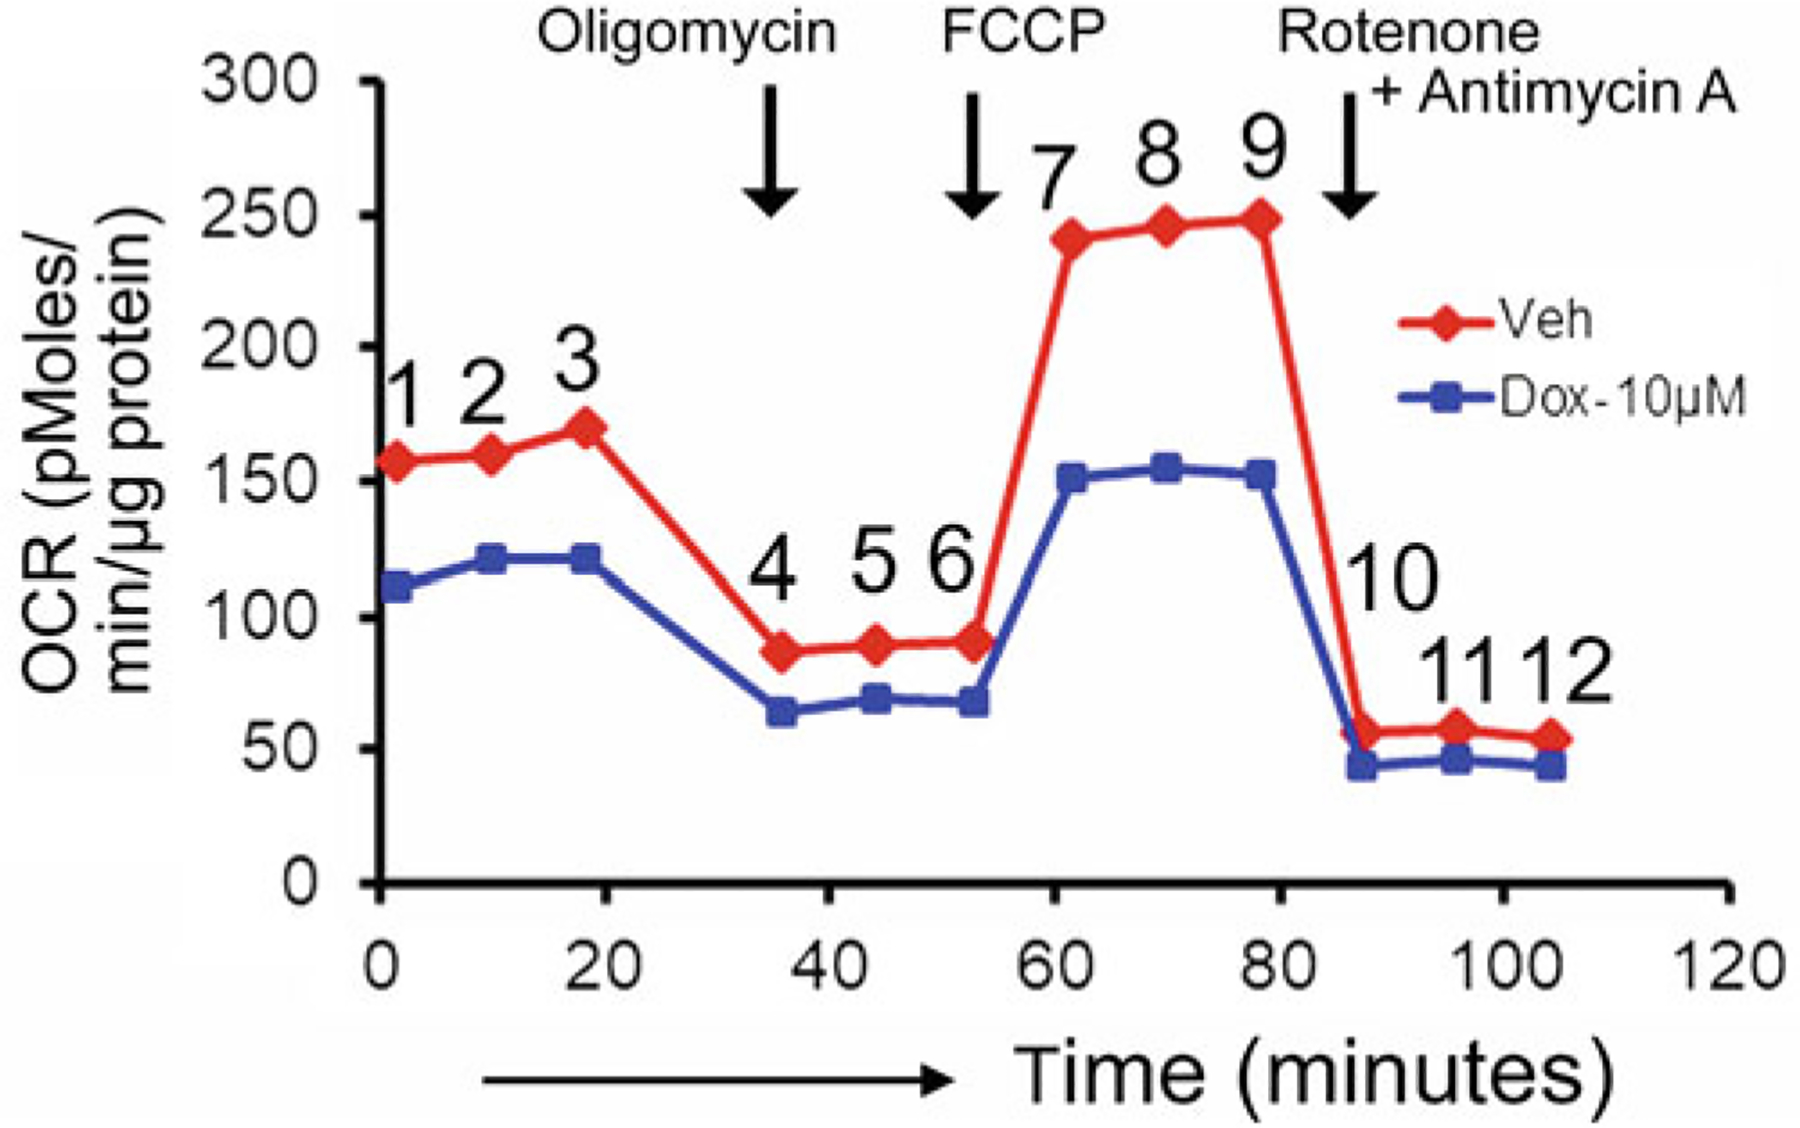
Fig. 2.

Measurement of mitochondrial respiration in DOX-treated neonatal rat cardiomyocytes. Examples of oxygen consumption rates (OCR) tracing in vehicle and DOX-treated (10 μM, 24 h) cardiomyocytes. Oligomycin (1 μM), FCCP (4 μM), Rotenone (0.5 μM) and Antimycin A (0.5 μM) were sequentially injected at indicated time points (black arrows). OCR values are represented as pmol/min/μg of protein. Numerical values indicate data points where average values from replicate wells at particular time points are analyzed and plotted for OCR profiles in vehicle and DOX-treated cardiomyocyte wells
