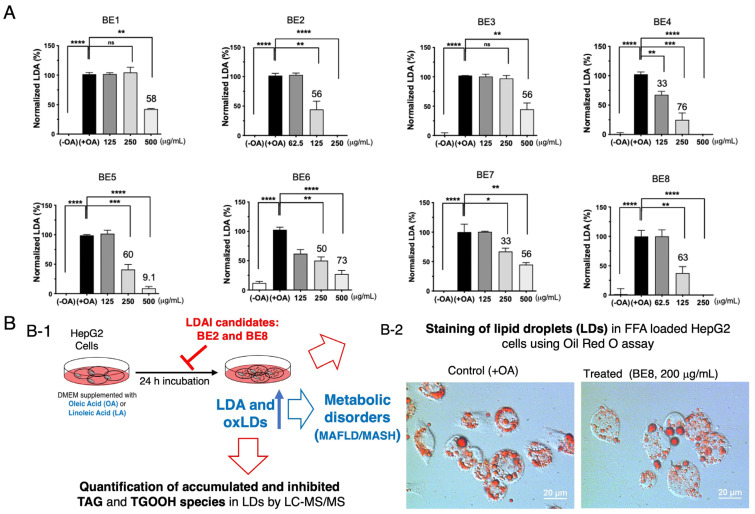
Figure 1.
(A) LDAI activity of selected bean extracts on OA-loaded HepG2 cells. Graph showing the mean values of the LDAI (four replications). **** p < 0.0001, *** p < 0.001, ** p < 0.01, * p < 0.05 and ns not significance, one-way analysis of variance (ANOVA) with Tukey’s multiple comparisons test when compared with the untreated control. (B) (B-1) Discovery of the LDAI candidate strategy: Quantification of TAG and TGOOH accumulation and inhibition in LDs using Orbitrap-LC-MS/MS analysis under OA and LA conditions. (B-2) LDAI activity of bioactive BE8 samples in HepG2 cells using an Oil Red O staining technique: phase contrast images showing LDs (red) in control (OA) and treated BE8 cells. The blue colors indicate free fatty acids (OA and LA) used in this study; the small blue arrow indicates the augmentation of LDA and oxLDs in HepG2 cells, and the big blue arrow indicates the metabolic disorders induced in LDA and oxLD conditions. The red colors indicate LDAI candidates that inhibit LDA and oxLDs, as illustrated by the red inhibition mark; the large red arrows indicate quantification of fluctuation of TAG and TGOOH under OA and LA conditions using LC-MS, and Oil Red O staining of LDs.

