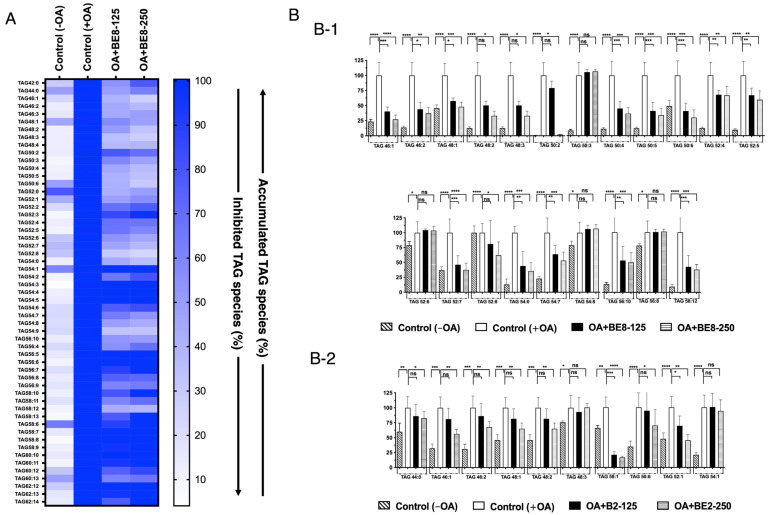
Figure 2.
(A) Heat map of accumulated and inhibited TAG species in cells. (B) Quantification of fluctuation of accumulated TAG species under OA treatment. Analysis of triacylglycerol molecular species under OA treatment with: (B-1) BE8 sample and (B-2) BE2 sample. Graph showing the mean values of the LDA and LDAI (six replications) **** p < 0.0001, *** p < 0.001, ** p < 0.01, * p < 0.05 and ns not significance, one-way analysis of variance (ANOVA) with Tukey’s multiple comparisons test when compared with the untreated control (+OA) group. ns, not significant; TAG, triacylglycerol; OA, oleic acid.

