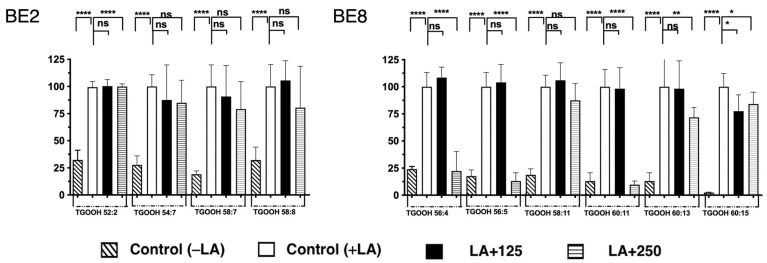
Figure 5.
Quantification of fluctuation of accumulated TGOOH species under LA treatment. Analysis of triacylglycerol molecular species under LA treatment with BE2 and BE8. Graph showing the mean values of the LDA and LDAI (six replications) **** p < 0.0001, ** p < 0.01, * p < 0.05 and ns not significance, one-way analysis of variance (ANOVA) with Tukey’s multiple comparisons test when compared with the untreated control (+LA) group. ns: not significant; TGOOH, triacylglycerol hydroperoxide; LA, linoleic acid.

