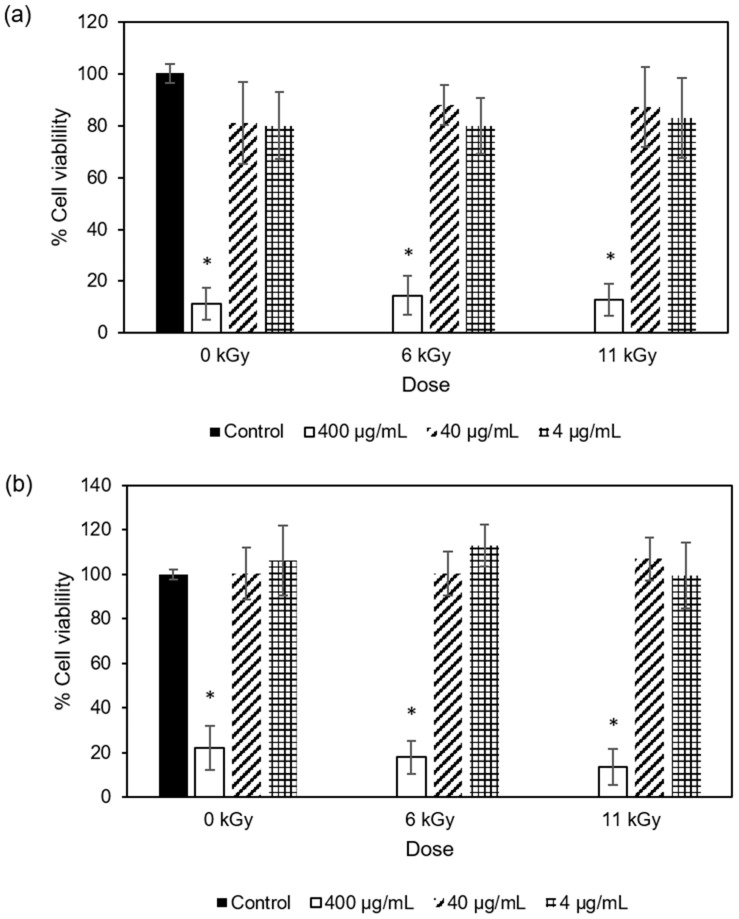
Figure 2.
Cellular viability of (a) 293-T and (b) RAW 264.7 cell lines in the presence of extracts from non-irradiated COP and COP irradiated at 6 kGy or 11 kGy at three different concentrations (400 μg/mL, 40 μg/mL, and 4 μg/mL). The control is used for comparison and does not contain any extract. Each bar graph represents the mean and 95% confidence interval from three separate experiments. For each cell line, bars with * indicate a statistically significant difference from control at p < 0.05.

