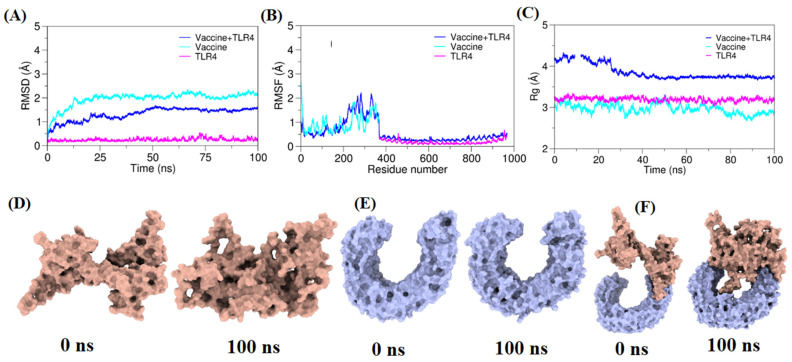
Figure 5.
The molecular dynamic plots for TLR4 and vaccine construct complex. (A) Root mean square deviation (RMSD) plot of the vaccine–TLR4 complex. (B) Root mean square fluctuation (RMSF) plot of the vaccine–TLR4 complex. (C) Radius of gyration (Rg) plot for the vaccine–TLR4 complex. The left panel from 0 ns indicates the initial structure of the moieties, and the rightmost 100 ns panel indicates the final conformation of the moieties. (D) Represents 0 ns and 100 ns frames from vaccine construct simulation; (E) Represents 0 ns and 100 ns frames from TLR4 simulation; (F) Represents 0 ns and 100 ns frames from vaccine–TLR4 simulation.

