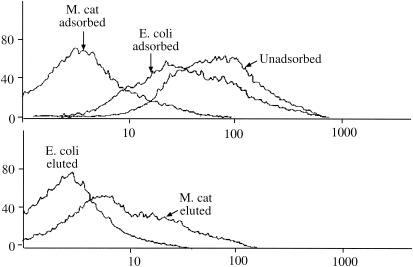
FIG. 4.
Results of flow cytometry with M. catarrhalis strain 87P15B1. Fluorescence is shown on the x axis (in arbitrary units), and the number of cells is shown on the y axis. Serum fractions of the homologous postclearance serum sample 87E16 are noted. (Top) Adsorption with M. catarrhalis (M. cat) caused a prominent reduction in fluorescence as detected by a shift to the left of the adsorbed serum compared to unadsorbed serum. (Bottom) Eluted antibodies recognize epitopes on the surface of M. catarrhalis as indicated by prominent staining of M. catarrhalis cells by the eluted antibodies.

