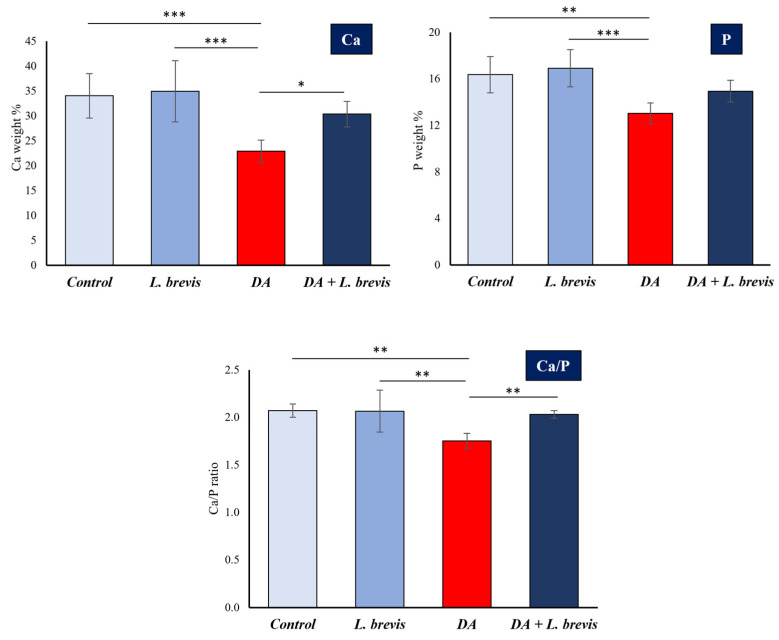
Figure 4.
Variations of the concentration values by weight (%) of calcium (Ca) and phosphorous (P) of dental enamel analyzed using EDS in specimens from the four different groups: control, L. brevis, DA, and DA + L. brevis. The results are expressed as mean values ± SD (top panels). The values of the Ca/P ratios according to the different treatment groups are shown in the bottom histogram. Asterisks indicate statistical differences among groups (* p < 0.05; ** p < 0.01; *** p < 0.001).

