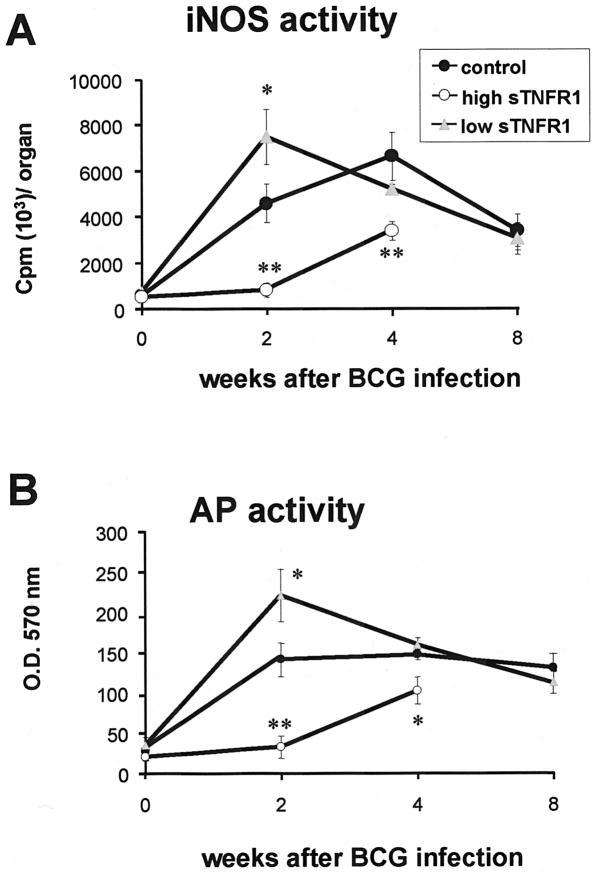
FIG. 4.
Decreased iNOS activity in spleens from transgenic mice expressing high levels of sTNFR1 and enhanced iNOS activity in transgenic mice expressing low levels of sTNFR1 after BCG infection. (A) iNOS activity was determined in crude spleen extracts from control mice, transgenic mice expressing high levels of sTNFR1 (high sTNFR1), and transgenic mice expressing low levels of sTNFR1 (low sTNFR1) before BCG infection (n = 3) and 2 weeks (n = 4), 4 weeks (n = 4 to 5), and 8 weeks (n = 4) after BCG infection. The data are expressed in cpm of 14C per organ and are means ± standard errors of the means. One asterisk indicates that the P value is <0.05, and two asterisks indicate that the P value is <0.01. The results are representative of the results of two independent experiments. (B) Reduced acid phosphatase (AP) activity in transgenic mice expressing high levels of sTNFR1 and enhanced activity in transgenic mice expressing low levels of sTNFR1 after BCG infection. Acid phosphatase activity was quantified in crude spleen extracts from control mice, transgenic mice expressing high levels of sTNFR1, and transgenic mice expressing low levels of sTNFR1 before BCG infection (n = 3) and 2 weeks (n = 4), 4 weeks (n = 4 to 5), and 8 weeks (n = 4) after BCG infection. The data are expressed as optical density at 570 nm (O.D.570 nm) in the organ and are means ± standard errors of the means. One asterisk indicates that the P value is <0.04, and two asterisks indicate that the P value is <0.008). The results are representative of the results of two independent experiments.

