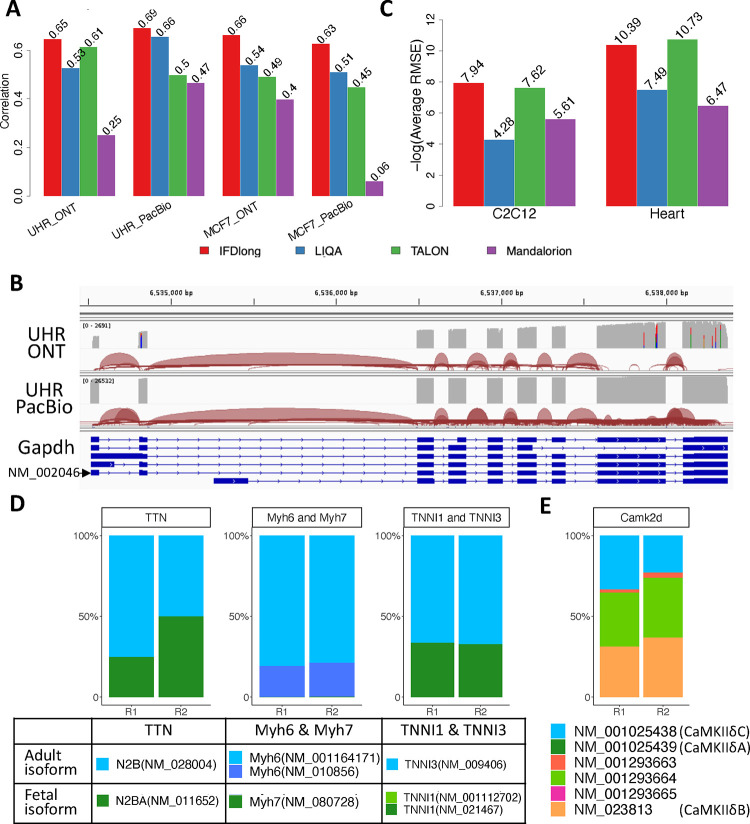
Figure 4: Application of isoform detection in real human and mouse studies.
(A) Spearman’s correlation of isoform quantification in human studies: UHR sequenced by ONT and PacBio, and MCF7 breast cancer cell line sequenced by ONT and PacBio. (B) Illustration of multiple isoforms of gene Gapdh supported by long reads in UHR dataset. (C) Consistency measurement (−log10(average RMSE)) of isoform quantification in mouse studies: C2C12 cell line with four repeats and mouse heart tissues with two repeats. (D) Relative abundance of adult and fetal isoforms quantified by IFDlong pipeline on mouse heart tissues. (E) Relative abundance of multiple alternative splicing events of Camk2d quantified by IFDlong pipeline on mouse heart tissues.

