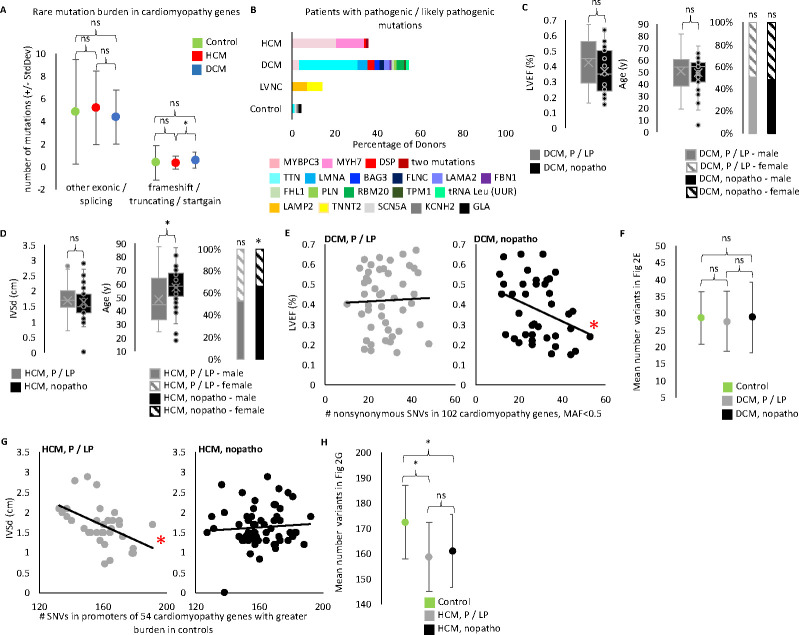
Figure 2. WGS confirms cumulative role of cardiomyopathy variants.
A. We performed WGS on 299 of the 300 iPS lines and called SNPs and indels. From a starting pool of ~4.28 million SNPs and indels per donor iPS cell line (mean for biobank, Table S2) we found a mean of only 4–5 missense and splicing mutations per HCM or DCM line and 0.3–0.6 truncating, frameshift, and startgain mutations per HCM or DCM line when we focus on potentially pathogenic variants by filtering for rare variants in 235 cardiomyopathy genes (pool 1 variants in Figure S2, filtered for frequency <0.001). We found control samples show no difference in the number of rare candidate variants in cardiomyopathy genes compared to diseased samples. Rare candidate truncating, frameshift, or startgain mutations (i.e. mutations potentially altering protein length) in cardiomyopathy genes were more common in DCM than HCM. (t-test: DCM vs HCM p-value = 0.0199477. Control vs HCM p-value = 0.9479979. DCM vs Control p-value = 0.2322563). Rare missense and splicing mutations show no difference by disease status. (t-test: Control vs HCM p-value = 0.5390647. Control vs DCM p-value = 0.4026431. HCM vs DCM p-value = 0.05390647). Plotted are the mean number of filtered mutations per line in each disease cohort. Error bars indicated standard deviation. B. We identified a pathogenic or likely pathogenic (P/LP) mutation for 86 out 203 diseased iPS lines. Plotted is the percentage of lines with an identified P/LP mutation by gene for each disease category. The HCM line with two mutations has ALPK3 and MYBPC3 mutations. The control line with a GLA mutation was classified as Other due to the donor’s known condition of Fabry disease (an HCM lookalike syndrome). The other two mutations found in control lines are probably not pathogenic in these donors, however we list their finding here as evidence of the background rate of finding pathogenic mutations when applying our filtering and classification workflow to non-cardiomyopathy donors. C. We compared echocardiogram and demographic data of the DCM donors with a P/LP mutation identified in the iPS line and those without (referred to as nopatho). Neither LVEF, nor age, nor sex differ between P/LP and nopatho in DCM. (LVEF t-test: p-value = 0.09055781 [p-value 0.08214506 when limit to DCM donors with clinical diagnosis, data not shown]. Age t-test: p-value =0.64370666 [p-value 0.569830699 when limit to DCM donors with clinical diagnosis, data not shown]. Sex chi-square: P/LP male vs female p-value = 0.8864 [p-value 0.6617 when limit to DCM donors with clinical diagnosis, data not shown]. nopatho male vs female p-value = 0.8728 [p-value 0.8694 when limit to DCM donors with clinical diagnosis, data not shown].) D. For HCM, P/LP donors are younger (t-test: p-value = 0.00921755), but show no difference in IVSd (t=test: p-value = 0.60639198). Nopatho lines are more commonly male than female, while P/LP lines are equally male and female. (chi-square: nopatho male vs female p-value = 0.0092. P/LP male vs female p-value = 0.7389). E. Pucklewartz et al. defined 102 cardiomyopathy genes whose nonsynonymous SNV mutation burden correlated with LVEF in DCM but not with any HCM echocardiogram metrics tested. We found increased cumulative burden of nonsynonymous variants with a minor allele frequency (MAF) <0.5 in the 102 Puckelwartz genes correlated with worse LVEF only in the nopatho samples (right, linear regression: p-value = 0.03141 [p-value = 0.04568 when limit to DCM donors with clinical diagnosis, data not shown; p-value = 0.05929 when remove MAF filter, data not shown.]) but not P/LP samples (left, linear regression: p-value = 0.8093 [p-value = 0.7954 when limit to DCM donors with clinical diagnosis, data not shown. p-value = 0.7514 when remove MAF filter, data not shown]). F. However the mean number of nonsynonymous variants in the Puckelwartz et al. genes is not different between the nopatho and P/LP cohorts nor between either DCM cohort and control. (t-test: nopatho vs control p-value = 0.984052497. P/LP vs control p-value = 0.469184129. P/LP vs nopatho p-value = 0.600062881.) Bars represent standard deviation. G. We found 54 of the Puckelwartz et al genes had lower mean number of SNVs in the promoter region, in HCM than control. Greater SNVs in this subset of promoters correlated with less enlarged IVSd measurements in the P/LP HCM samples but not the nopatho HCM samples. (Linear regression: P/LP p-value = 0.003773. Nopatho p-value = 0.5669). H. As selected for, control samples had greater SNVs in these 54 promoters. There was no difference in the mean SNV count between P/LP and nopatho HCM samples. (t-test: nopatho vs control p-value = 0.00000497. P/LP vs control p-value = 0.00000491. P/LP vs nopatho p-value = 0.439656222.) Bars represent standard deviation.

