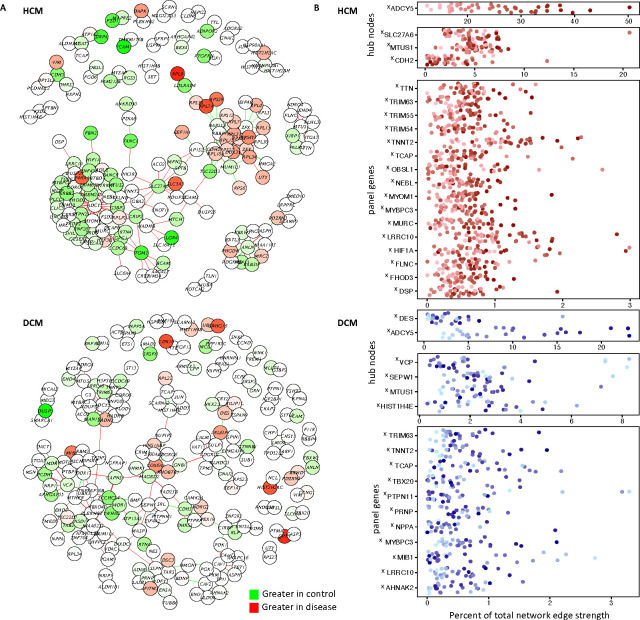
Figure 3. Personalized co-expression networks capture otherwise undetectable genes contributing to the disease signature and reveals line-specific differences in network activation.
A. We calculated an HCM and DCM co-expression network using lionessR, an algorithm for Linear Interpolation to Obtain Network Estimates for Single Samples. (Genes/nodes are represented as circles. Edges are represented as lines. Green indicates stronger edges or greater expression [nodes] in control, while red indicates stronger edges/greater expression in disease.) B. We the inferred personalized co-expression networks for individual lines. For select genes we highlight their contribution to the network (sum of their edge strengths as a percentage of the total edge strengths of the network), plotted for each sample. Samples are colored by their ADCY5 ranking. X indicates genes which only show up in this lines-specific co-expression analysis but are not flagged as significant in traditional DESeq2 analyses for differential expression between control and disease. Panel genes refers to cardiomyopathy gene list used to annotate pathogenic variants.

