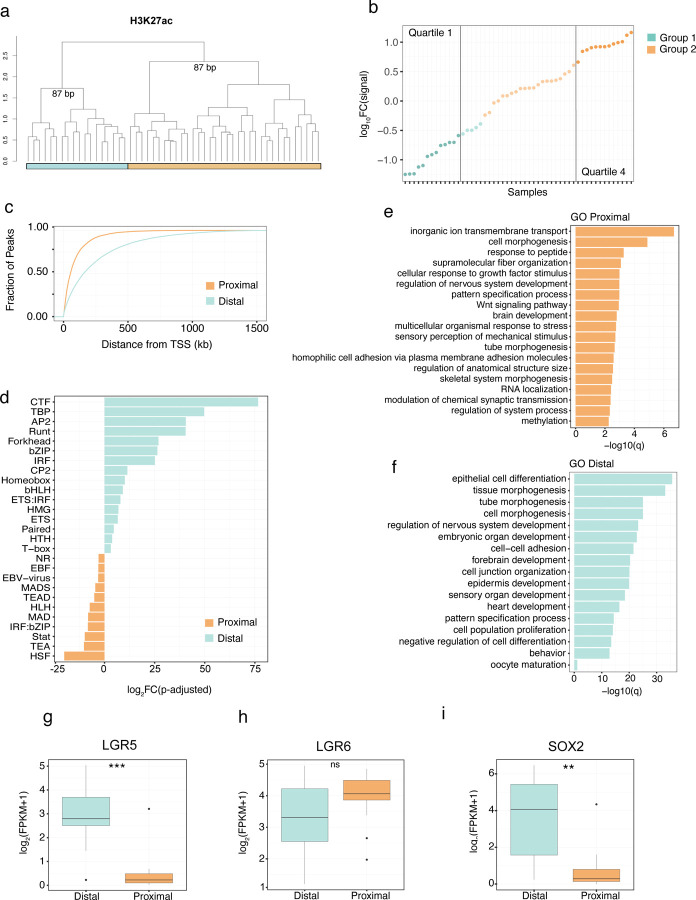
Figure 2. Distinct H3K27ac marker enhancer groups.
(a) Unsupervised hierarchal clustering of the top 1 % most variable 500bp bins of genome wide H3K27ac signal (distance = 1 - spearman correlation, ward.D2 clustering method). (b) Log10(signal intensity) of group 1 specific enhancer regions – log10(signal intensity) of group 2 specific enhancer regions. (c) Fraction of the group-specific peaks plotted against the distance to the transcription start site of genes (TSS) for the upper (Q1) and lower (Q4) quartiles of the distribution. (d) Fold change difference of transcription factor family motifs enriched at either the distal or proximal group specific enhancers. Gene Ontology enrichment analysis of differentially expressed genes between the (e) proximal and (f) distal group. Difference in expression between the distal and proximal groups of stem and epithelial markers including (g) LGR5, (h) LGR6 and (i) SOX2. ** indicates P-value < 0.01, *** indicates P-value < 0.001 for a Welch two-sample t test. Abbreviations: BP, bootstrap probability.

